

Question: Attach a spreadsheet showing calculation and a Word document showing your work and how you arrived at RBS's funding needs. Refer again to the case,
Attach a spreadsheet showing calculation and a Word document showing your work and how you arrived at RBS's funding needs. Refer again to the case, Walnut Venture Associates (A). Refer to the financials in the case exhibits. Note that the working capital requirement is missing in the cash flow statement (last exhibit). You will provide the spreadsheet with three scenarios. One is the base case as is in the case exhibit but include working capital investment in estimating the net cash flow. Note that the working capital is the current assets net of cash minus the current liabilities adjusted for deferred taxes (use the balance sheet for the prior year) and use the percentage of sales approach (the working capital to the sales for the prior year) to project the net working capital investment required in future. In the second scenario, consider a lower growth rate in RBS's sales (since entrepreneurs overestimate the sales projections) and then you re-estimate the cash flow. In the third scenario, keep the sales projections as given in the case but increase the projected costs and operating expenses (since entrepreneurs underestimate the costs), and then you re-estimate the net cash flow. The scenarios will result in net cash deficits that indicate RBS's funding requirements and the timing when the funding will be needed. The three scenarios will be on three tabs on one Excel spreadsheet, and the Word document will explain how you arrived at RBS's funding needs and timing. You will justify your assumptions.
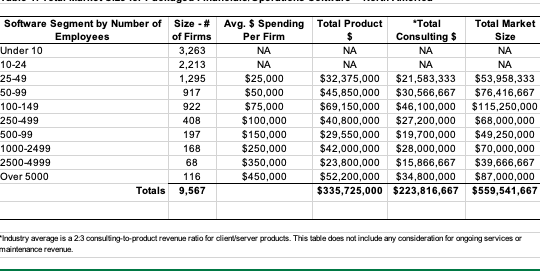
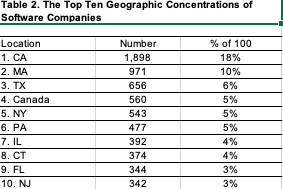
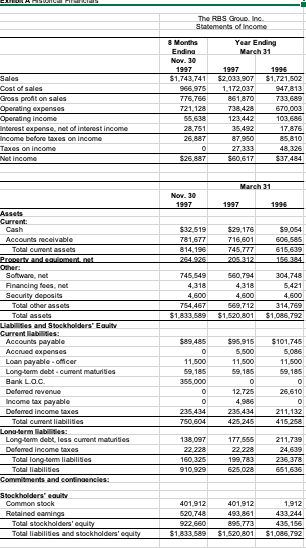
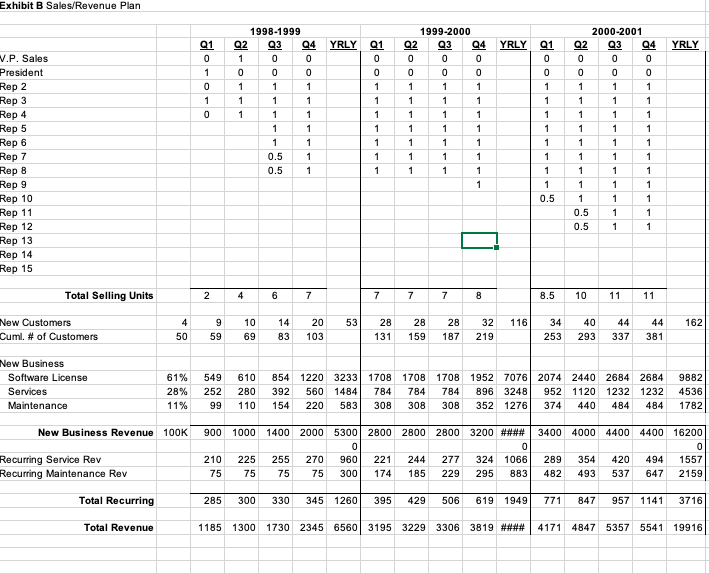
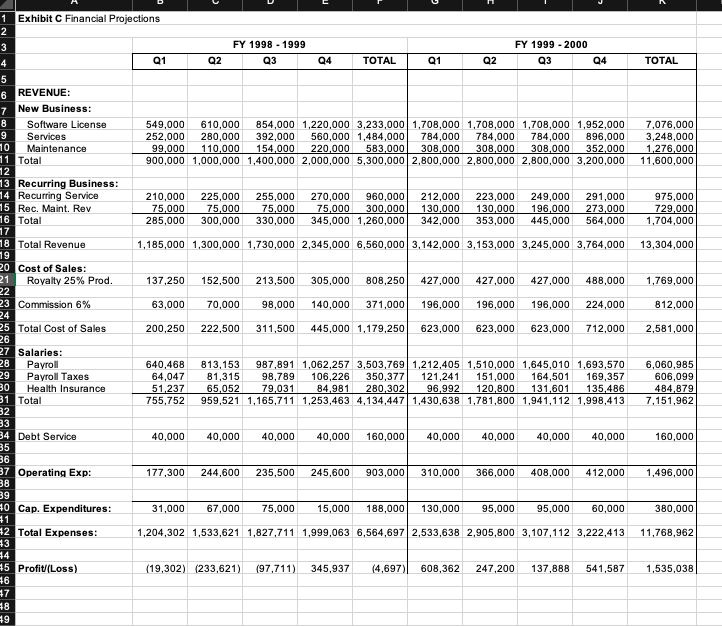
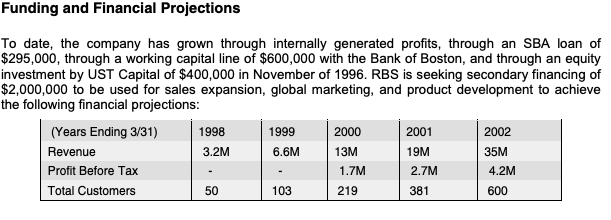
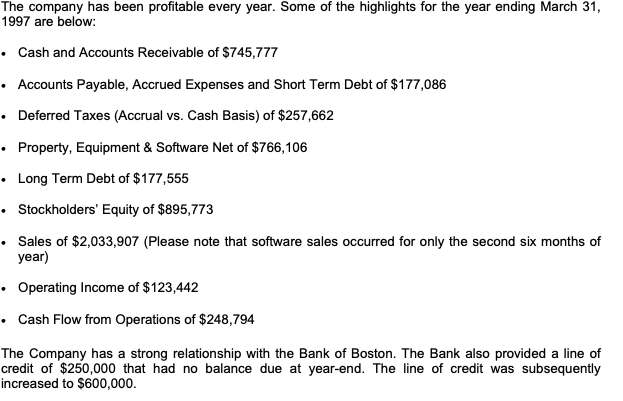
Industry average is a 2.3 consulfing-bo-product reverve rafio for cliertberver products. This table does not include arry consideration for angaing services or nairtertance reveriua. Table 2. The Top Ten Geographic Concentrations of Software Companies The ReS Groua Inc. Statements of Income Commitments and coentinaencles: Stockholders' eault \begin{tabular}{|l|r|r|r|} \hline Common stock & 401,912 & 401,912 & 1,912 \\ \hline Retained eamings & 520,748 & 493,861 & 433,244 \\ \hline Total stockholders' equity & 922,660 & 895,773 & 435,156 \\ \hline Total liabilities and stockholders' equity & $1,833,589 & $1,520,801 & $1,066,792 \\ \hline \end{tabular} Exhibit R Sala'RavanuA Plan Exhibit C Financial Projections \begin{tabular}{|l|r|} \hline FY 19981999 & FY 19992000 \\ \hlineQ190 & 03 \\ \hline \end{tabular} REVENUE: New Business: 8 Software License Services Total Cost of Sales: Royalty 25\% Prod. Salaries: Payroll Payroll Taxes Total \begin{tabular}{|r|r|r|r|r|r|r|r|r||r||} \hline 640,468 & 813,153 & 987,891 & 1,062,257 & 3,503,769 & 1,212,405 & 1,510,000 & 1,645,010 & 1,693,570 & 6,060,985 \\ \hline 64,047 & 81,315 & 98,789 & 106,226 & 350,377 & 121,241 & 151,000 & 164,501 & 169,357 & 606,099 \\ \hline 51,237 & 65,052 & 79,031 & 84,981 & 280,302 & 96,992 & 120,800 & 131,601 & 135,486 & 484,879 \\ \hline 755,752 & 959,521 & 1,165,711 & 1,253,463 & 4,134,447 & 1,430,638 & 1,781,800 & 1,941,112 & 1,998,413 & 7,151,962 \\ \hline \end{tabular} Debt Service Operating Exp: Cap. Expenditures: Total Expenses: unding and Financial Projections o date, the company has grown through internally generated profits, through an SBA loan of 295,000 , through a working capital line of $600,000 with the Bank of Boston, and through an equity ivestment by UST Capital of $400,000 in November of 1996. RBS is seeking secondary financing of 2,000,000 to be used for sales expansion, global marketing, and product development to achieve he following financial projections: 1997 are below: - Cash and Accounts Receivable of $745,777 - Accounts Payable, Accrued Expenses and Short Term Debt of $177,086 - Deferred Taxes (Accrual vs. Cash Basis) of $257,662 - Property, Equipment \& Software Net of $766,106 - Long Term Debt of $177,555 - Stockholders' Equity of $895,773 - Sales of $2,033,907 (Please note that software sales occurred for only the second six months of year) - Operating Income of $123,442 - Cash Flow from Operations of $248,794 The Company has a strong relationship with the Bank of Boston. The Bank also provided a line of credit of $250,000 that had no balance due at year-end. The line of credit was subsequently increased to $600,000. Industry average is a 2.3 consulfing-bo-product reverve rafio for cliertberver products. This table does not include arry consideration for angaing services or nairtertance reveriua. Table 2. The Top Ten Geographic Concentrations of Software Companies The ReS Groua Inc. Statements of Income Commitments and coentinaencles: Stockholders' eault \begin{tabular}{|l|r|r|r|} \hline Common stock & 401,912 & 401,912 & 1,912 \\ \hline Retained eamings & 520,748 & 493,861 & 433,244 \\ \hline Total stockholders' equity & 922,660 & 895,773 & 435,156 \\ \hline Total liabilities and stockholders' equity & $1,833,589 & $1,520,801 & $1,066,792 \\ \hline \end{tabular} Exhibit R Sala'RavanuA Plan Exhibit C Financial Projections \begin{tabular}{|l|r|} \hline FY 19981999 & FY 19992000 \\ \hlineQ190 & 03 \\ \hline \end{tabular} REVENUE: New Business: 8 Software License Services Total Cost of Sales: Royalty 25\% Prod. Salaries: Payroll Payroll Taxes Total \begin{tabular}{|r|r|r|r|r|r|r|r|r||r||} \hline 640,468 & 813,153 & 987,891 & 1,062,257 & 3,503,769 & 1,212,405 & 1,510,000 & 1,645,010 & 1,693,570 & 6,060,985 \\ \hline 64,047 & 81,315 & 98,789 & 106,226 & 350,377 & 121,241 & 151,000 & 164,501 & 169,357 & 606,099 \\ \hline 51,237 & 65,052 & 79,031 & 84,981 & 280,302 & 96,992 & 120,800 & 131,601 & 135,486 & 484,879 \\ \hline 755,752 & 959,521 & 1,165,711 & 1,253,463 & 4,134,447 & 1,430,638 & 1,781,800 & 1,941,112 & 1,998,413 & 7,151,962 \\ \hline \end{tabular} Debt Service Operating Exp: Cap. Expenditures: Total Expenses: unding and Financial Projections o date, the company has grown through internally generated profits, through an SBA loan of 295,000 , through a working capital line of $600,000 with the Bank of Boston, and through an equity ivestment by UST Capital of $400,000 in November of 1996. RBS is seeking secondary financing of 2,000,000 to be used for sales expansion, global marketing, and product development to achieve he following financial projections: 1997 are below: - Cash and Accounts Receivable of $745,777 - Accounts Payable, Accrued Expenses and Short Term Debt of $177,086 - Deferred Taxes (Accrual vs. Cash Basis) of $257,662 - Property, Equipment \& Software Net of $766,106 - Long Term Debt of $177,555 - Stockholders' Equity of $895,773 - Sales of $2,033,907 (Please note that software sales occurred for only the second six months of year) - Operating Income of $123,442 - Cash Flow from Operations of $248,794 The Company has a strong relationship with the Bank of Boston. The Bank also provided a line of credit of $250,000 that had no balance due at year-end. The line of credit was subsequently increased to $600,000
Step by Step Solution
There are 3 Steps involved in it

Get step-by-step solutions from verified subject matter experts