

Question: Attached is the ANOVA question below with data table. Please provide 10 Step hypothesis for this ANOVA problem along with MATLAB code & image for
Attached is the ANOVA question below with data table. Please provide 10 Step hypothesis for this ANOVA problem along with MATLAB code & image for the ANOVA table, mention which ANOVA it is (1-way, 2-way , etc). Use function 'multcompare' if post analysis is needed. Thank you!
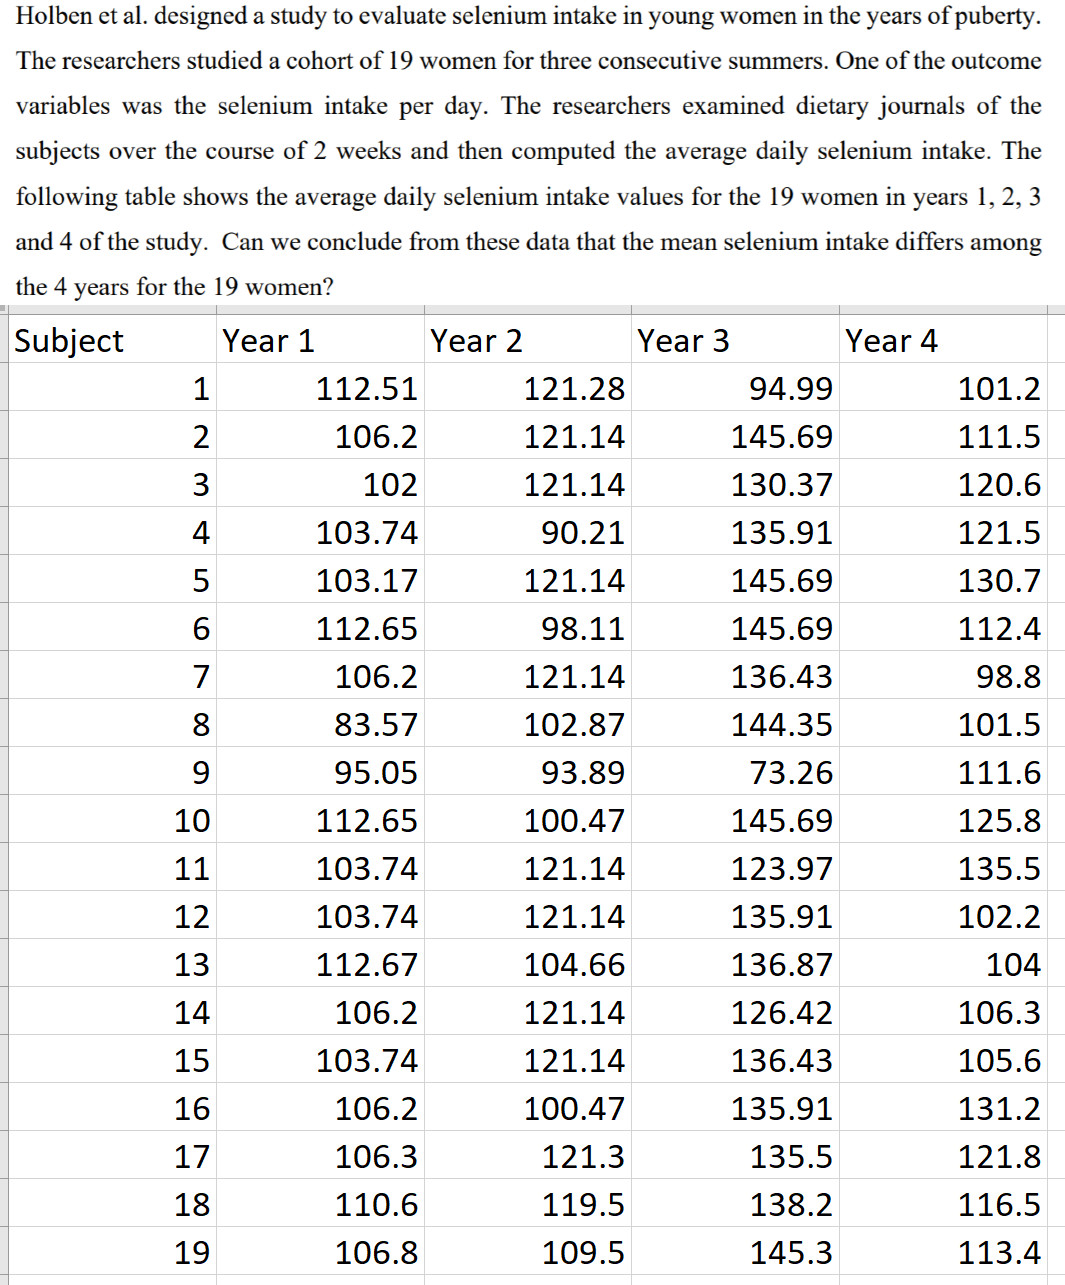
Holben et a1. designed a study to evaluate selenium intake in young women in the years of puberty. The researchers studied a cohort of 19 women for three consecutive summers. One of the outcome variables was the selenium intake per day. The researchers examined dietary journals of the subjects over the course of 2 weeks and then computed the average daily selenium intake. The following table shows the average daily selenium intake values for the 19 women in years 1, 2, 3 and 4 of the study. Can we conclude from these data that the mean selenium intake differs among the 4 years for the 19 women? Subject LDOO'JOWL-wal' l'l'l'l'l'l'l'l'l'l'i LDOONUWL-wal'O Year 1 112.51 106.2 102 103.74 103.17 112.65 106.2 83.57 95.05 112.65 103.74 103.74 112.67 106.2 103.74 106.2 106.3 110.6 106.8 Year 2 121.28 121.14 121.14 90.21 121.14 98.11 121.14 102.87 93.89 100.47 121.14 121.14 104.66 121.14 121.14 100.47 121.3 119.5 109.5 Year3 94.99 145.69 130.37 135.91 145.69 145.69 136.43 144.35 73.26 145.69 123.97 135.91 136.87 126.42 136.43 135.91 135.5 138.2 145.3 Year4 101.2 111.5 120.6 121.5 130.7 112.4 98.8 101.5 111.6 125.8 135.5 102.2 104 106.3 105.6 131.2 121.8 116.5 113.4
Step by Step Solution
There are 3 Steps involved in it

Get step-by-step solutions from verified subject matter experts