

Question: Attempt Average: !4 3. Operating breal-even graph analysis A. Aa when does a firm achieve it's operating break-even point? Your company is considering altering its
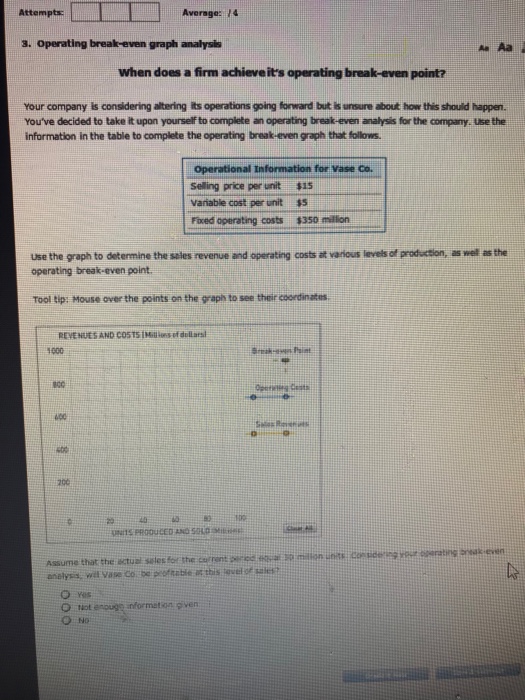
Attempt Average: !4 3. Operating breal-even graph analysis A. Aa when does a firm achieve it's operating break-even point? Your company is considering altering its operations going forward but is unsure about how this shouild happen. You've decided to take it upon yourself to complete an operating break-even analysis for the company. Use the information in the table to complete the operating break-even graph that follows Operational Information for vase co. Selling price per unit $15 Variable cost per unit $5 Fxed operating costs $350 mllion use the graph to determine the sales revenue and operating costs at various levels of produxtion, as wet as the operating break-even point Tool tip: Mouse over the points on the graph to see their coordinates REVENUES AND COSTS ? Hill ins ef dullarst 1000 200 Assume that the stua swles for the c ments wree iundei ar arin evwn Not nformaton given
Step by Step Solution
There are 3 Steps involved in it

Get step-by-step solutions from verified subject matter experts