

Question: 3. Operating break-aven graph analysis When does a firm achiave it's operating break-even point? Your company is considering attering its operations going forward but is
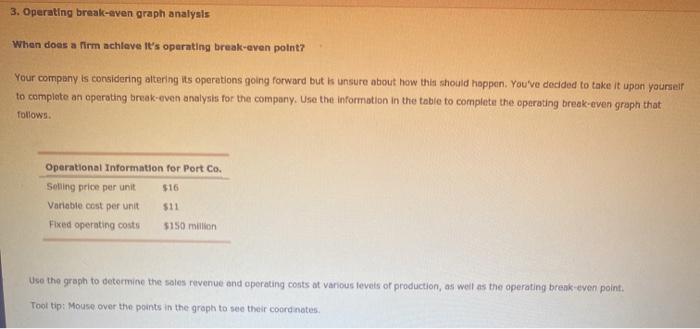
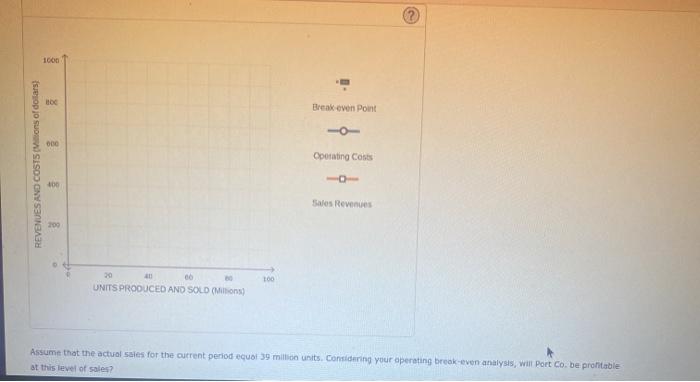
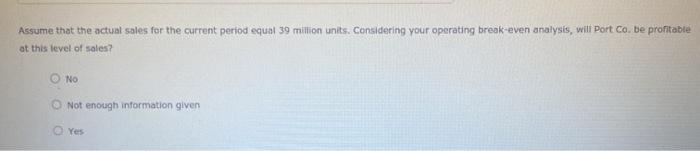
3. Operating break-aven graph analysis When does a firm achiave it's operating break-even point? Your company is considering attering its operations going forward but is unsure about how this should happen. You've decided to take it upon yourself to complete an operating break-even analysis for the company. Use the information in the table to complete the operating break-even graph that follows. Operational Information for Port Co. $16 Selling price per unit Variable cost per unit Fixed operating costs $11 5150 million Use the graph to determine the sales revenue and operating costs at various levels of production, as well as the operating break even point. Tooltip: Mouse over the points in the graph to see their coordinates icon 160 Break even Point OD Operating costs REVENUES AND COST5ions of dollars) 100 Sales Revenues 100 30 00 UNITS PRODUCED AND SOLD (Milions) Assume that the actual sales for the current period equal 39 million units. Considering your operating break-even analysis, Will Port Co. be profitable at this level of sales? Assume that the actual sales for the current period equal 39 million units. Considering your operating break-even analysis, will Port Co. De profitable at this level of sales? NO Not enough information given Yes
Step by Step Solution
There are 3 Steps involved in it

Get step-by-step solutions from verified subject matter experts