

Question: Attempts , 11 | Keep the Highest: 11/20 AaAa 2. Using historical data to measure portfolio risk and correlation coefficient future risk Julian is an
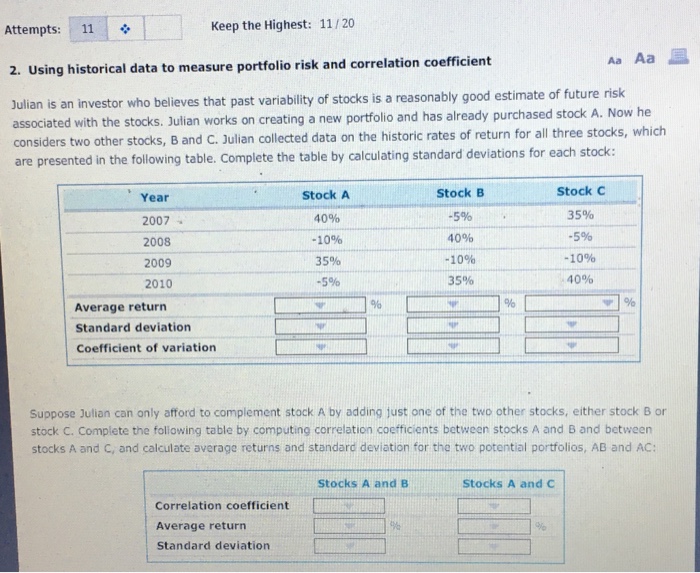
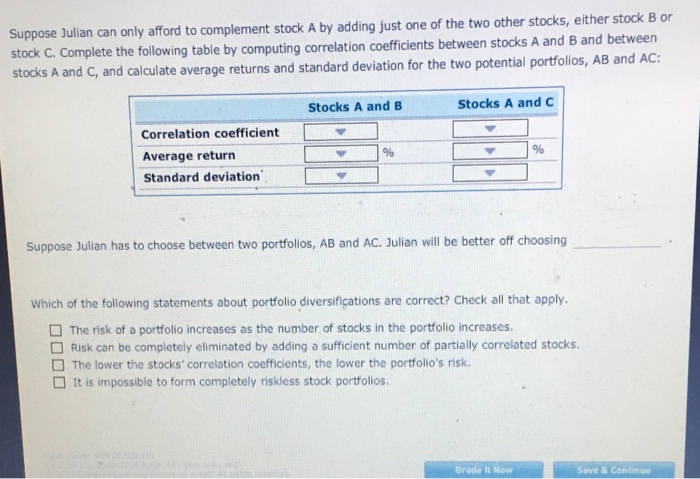
Attempts , 11 | Keep the Highest: 11/20 AaAa 2. Using historical data to measure portfolio risk and correlation coefficient future risk Julian is an investor who believes that past variability of stocks is a reasonably good estimate of associated with the stocks. Julian works on creating a new portfolio and has already purchased stock A. Now he considers two other stocks, B and C. Julian collected data on the historic rates of return for all three stocks, which are presented in the following table. Complete the table by calculating standard deviations for each stock: Stock A 40% -10% 35% -5% Stock B -5% 40% -10% 35% Stock C 35% -5% -10% 40% Year 2008 2009 2010 96 Average return Standard deviation Coefficient of variation Suppose Julian can only afford to complement stock A by adding just one of the two other stocks, either stock B or stock C. Complete the folilowing table by computing correlation coefficients between stocks A and B and between stocks A and C, and calculate average returns and standard deviation for the two potential portfolios, AB and AC: Stocks A and B Stocks A and C Correlation coefficient Average return Standard deviation
Step by Step Solution
There are 3 Steps involved in it

Get step-by-step solutions from verified subject matter experts