

Question: Attempts| 1.5 Keep the Higheat 1.5 / 3 . Application: Demand elasticity and agriculture The following graph illustrates the market for cashews. It plots the

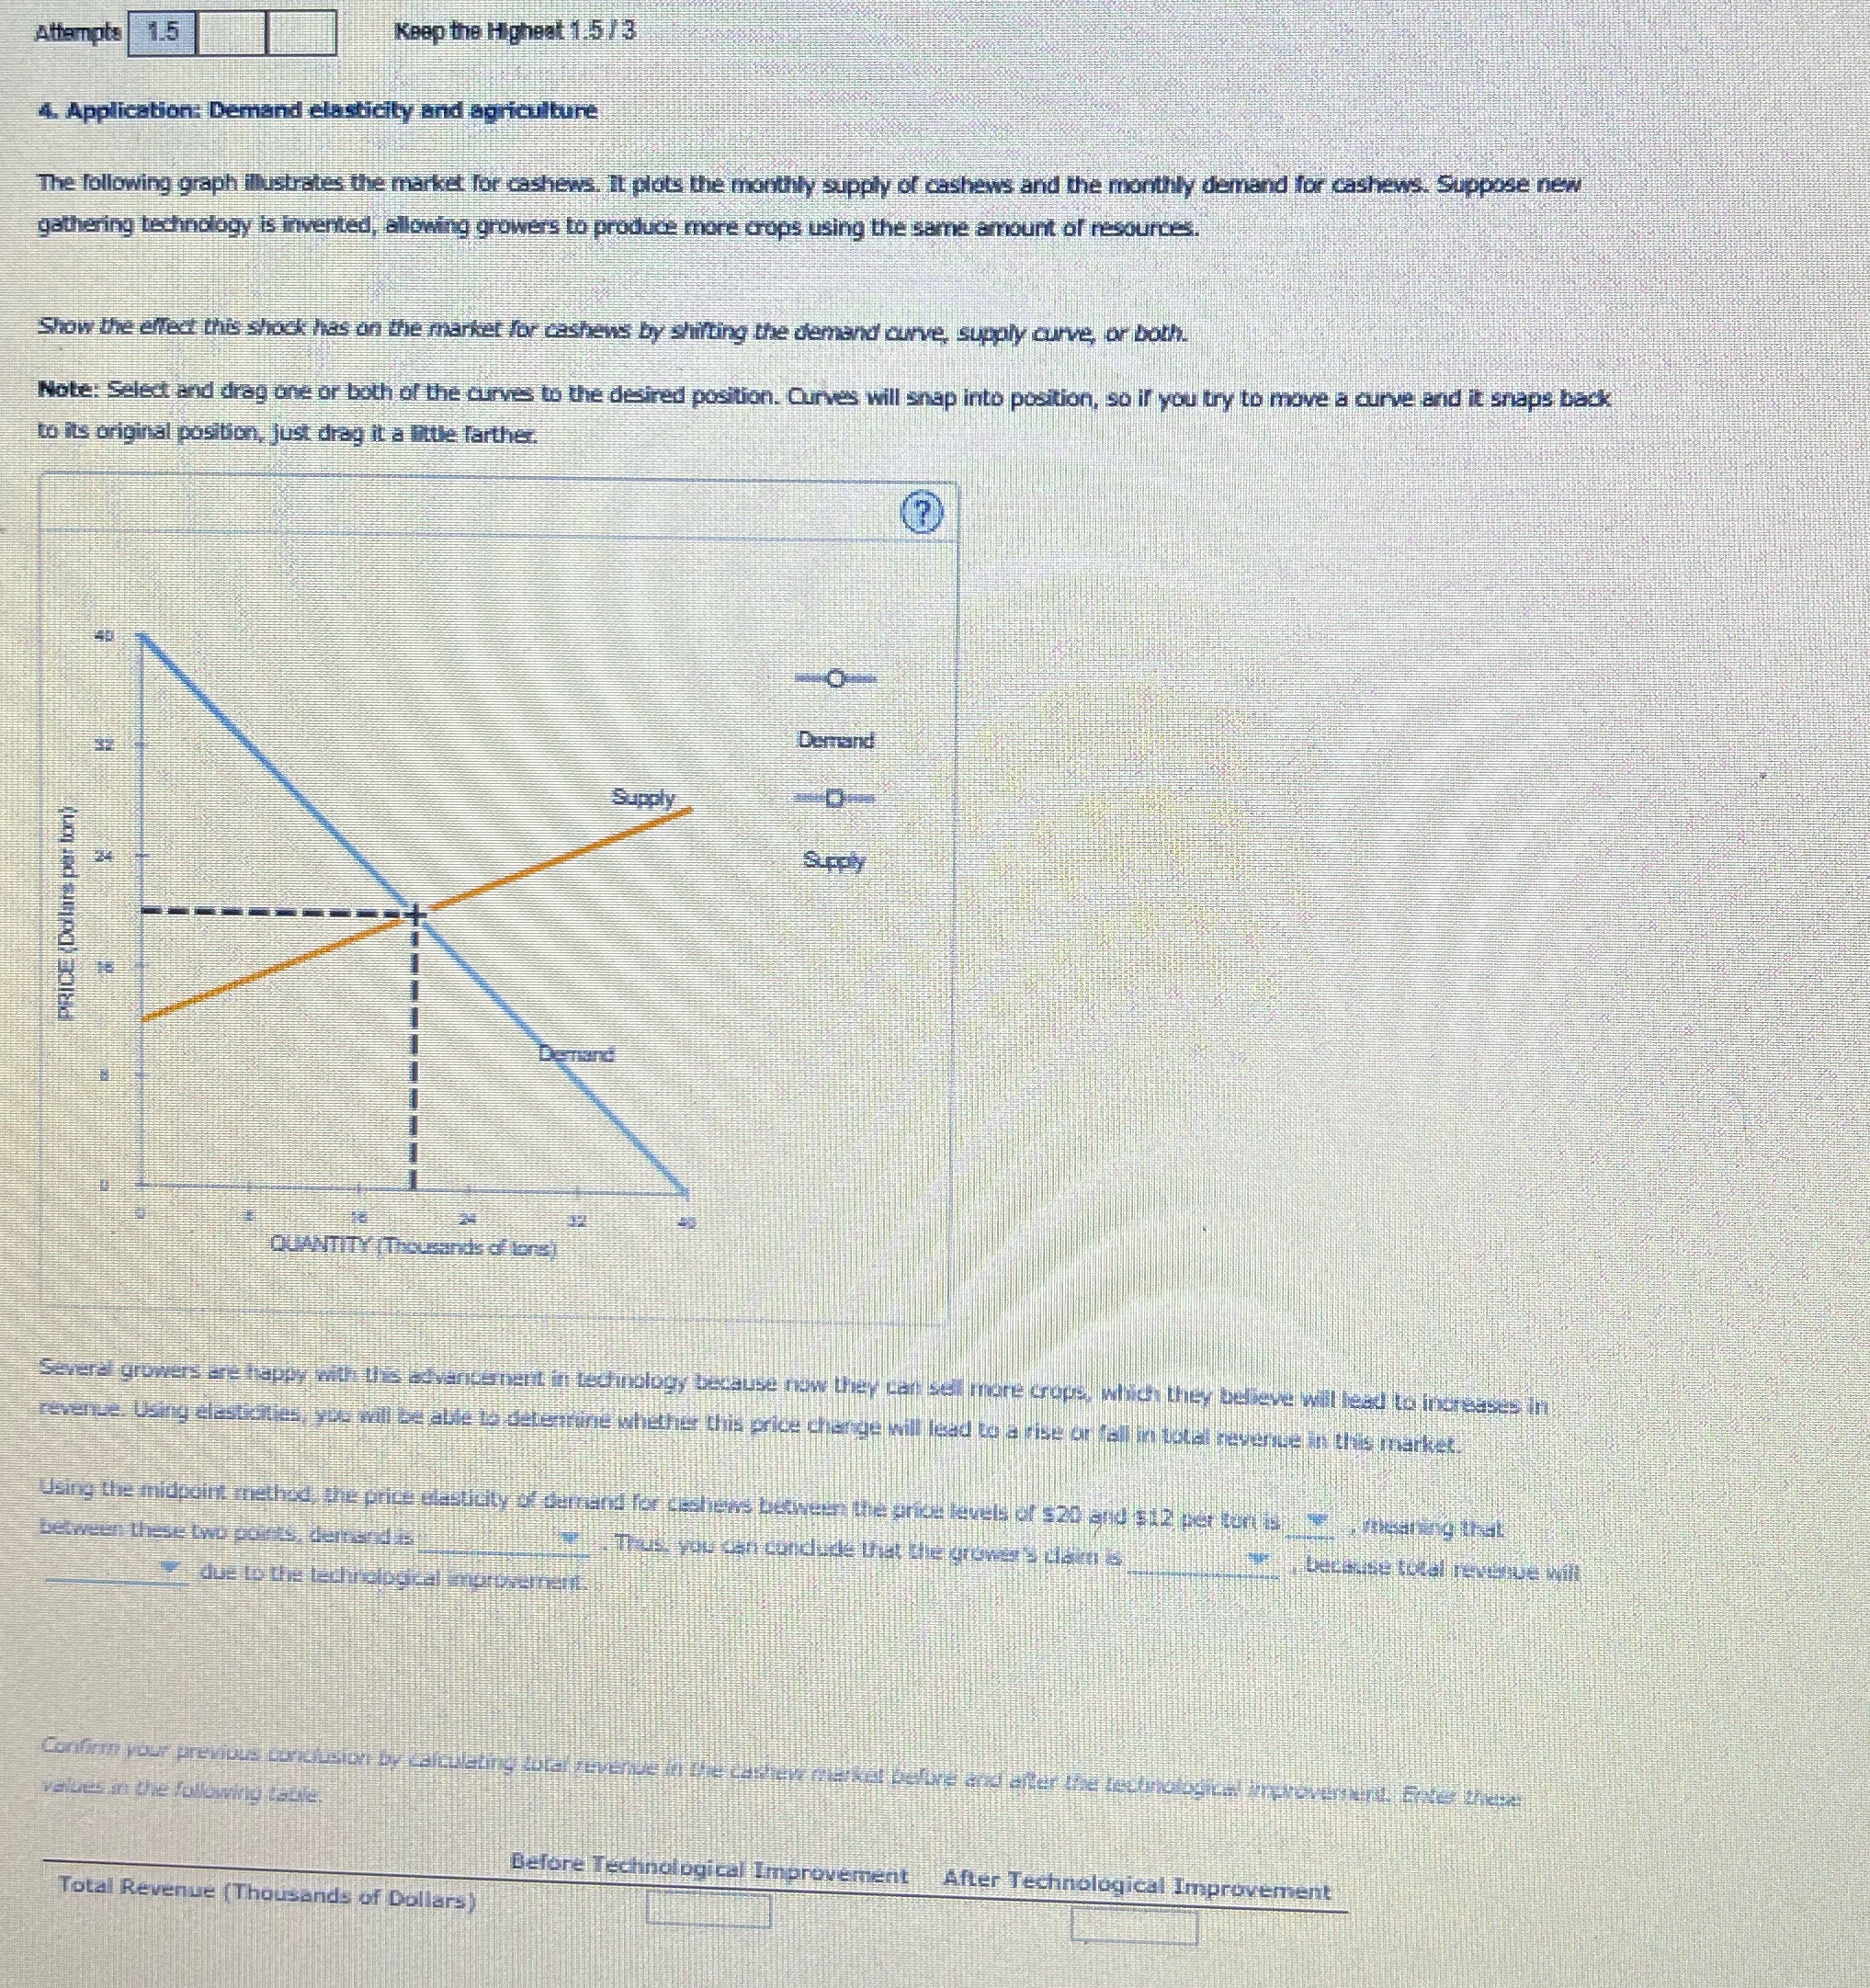
Attempts| 1.5 Keep the Higheat 1.5 / 3 . Application: Demand elasticity and agriculture The following graph illustrates the market for cashews. It plots the monthly supply of cashews and the monthly demand for cashews. Suppose new gathering technology is invented, allowing growers to produce more crops using the same amount of resources. Show the effect this shock has on the market for cashews by shifting the demand curve, supply curve, or both Note: Select and drag one or both of the curves to the desired position. Curves will snap into position, so if you try to move a curve and it snaps back to it's original position, just drag it a little farthe Demand Supply Supply PRICE QUANTITY ( Thousands of long) are happy with this advancement in technology because now they Share crops, which they believe will lead to increases In estrallies, you will be able to deterrunt thether this price change will lead to e in total revenue in theis market. Using the midpoint method, the price elasticity of demand for cast or $20 and $12 per ton is between these In po demand due to the technological morvern Confirm pour previous purolator by ing total clues in the Following taste. get belive and after the louanne voiced wherever Before Technological Improvement Total Revenue (Thousands of Dollars After Technological Improvement
Step by Step Solution
There are 3 Steps involved in it

Get step-by-step solutions from verified subject matter experts