

Question: atus , counterfeit , genuine Replace A B C D and E in the code below to create this plot. ggplot ( banknote , ,
atus
counterfeit
genuine
Replace
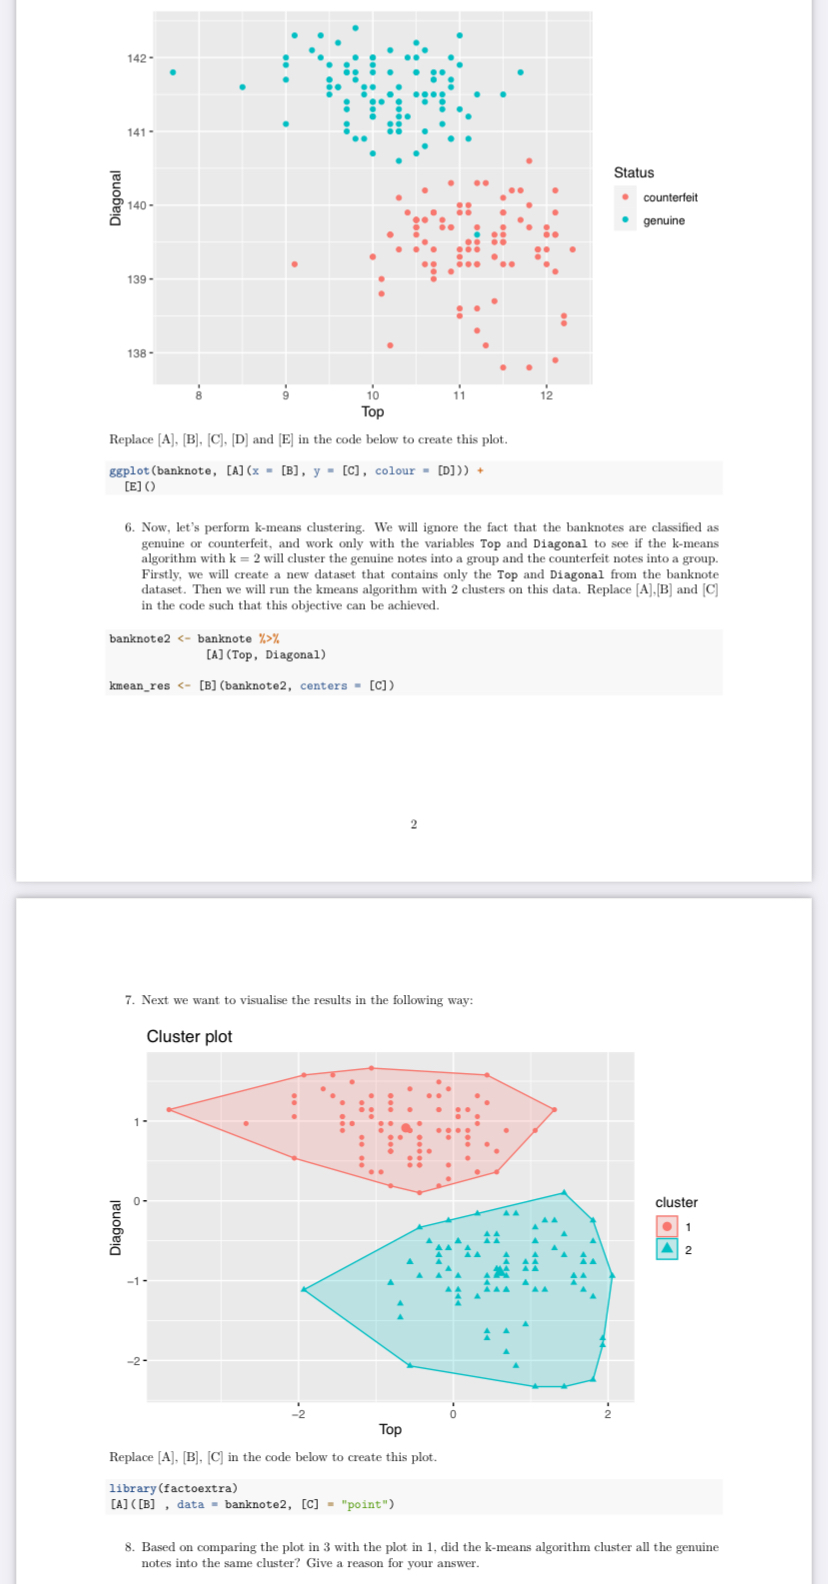
and in the code below to create this plot.
ggplot banknote colour
E
Now, let's perform kmeans clustering. We will ignore the fact that the banknotes are classified as genuine or counterfeit, and work only with the variables Top and Diagonal to see if the kmeans algorithm with will cluster the genuine notes into a group and the counterfeit notes into a group. Firstly, we will create a new dataset that contains only the Top and Diagonal from the banknote dataset. Then we will run the kmeans algorithm with clusters on this data. Replace
and in the code such that this objective can be achieved.
banknote banknote
ATop Diagonal
kmeanres Bbanknote centers C
Next we want to visualise the results in the following way:
library factoextra
data banknoteC "point"
Based on comparing the plot in with the plot in did the means algorithm cluster all the genuine notes into the same cluster? Give a reason for your answer.
Step by Step Solution
There are 3 Steps involved in it
1 Expert Approved Answer
Step: 1 Unlock

Question Has Been Solved by an Expert!
Get step-by-step solutions from verified subject matter experts
Step: 2 Unlock
Step: 3 Unlock