

Question: AutoSave OFF A A ? CG ... Module 1 HW - ANOVA_MANOVA Home Insert Draw Design Layout References Mailings Review View Acrobat Tell me Share
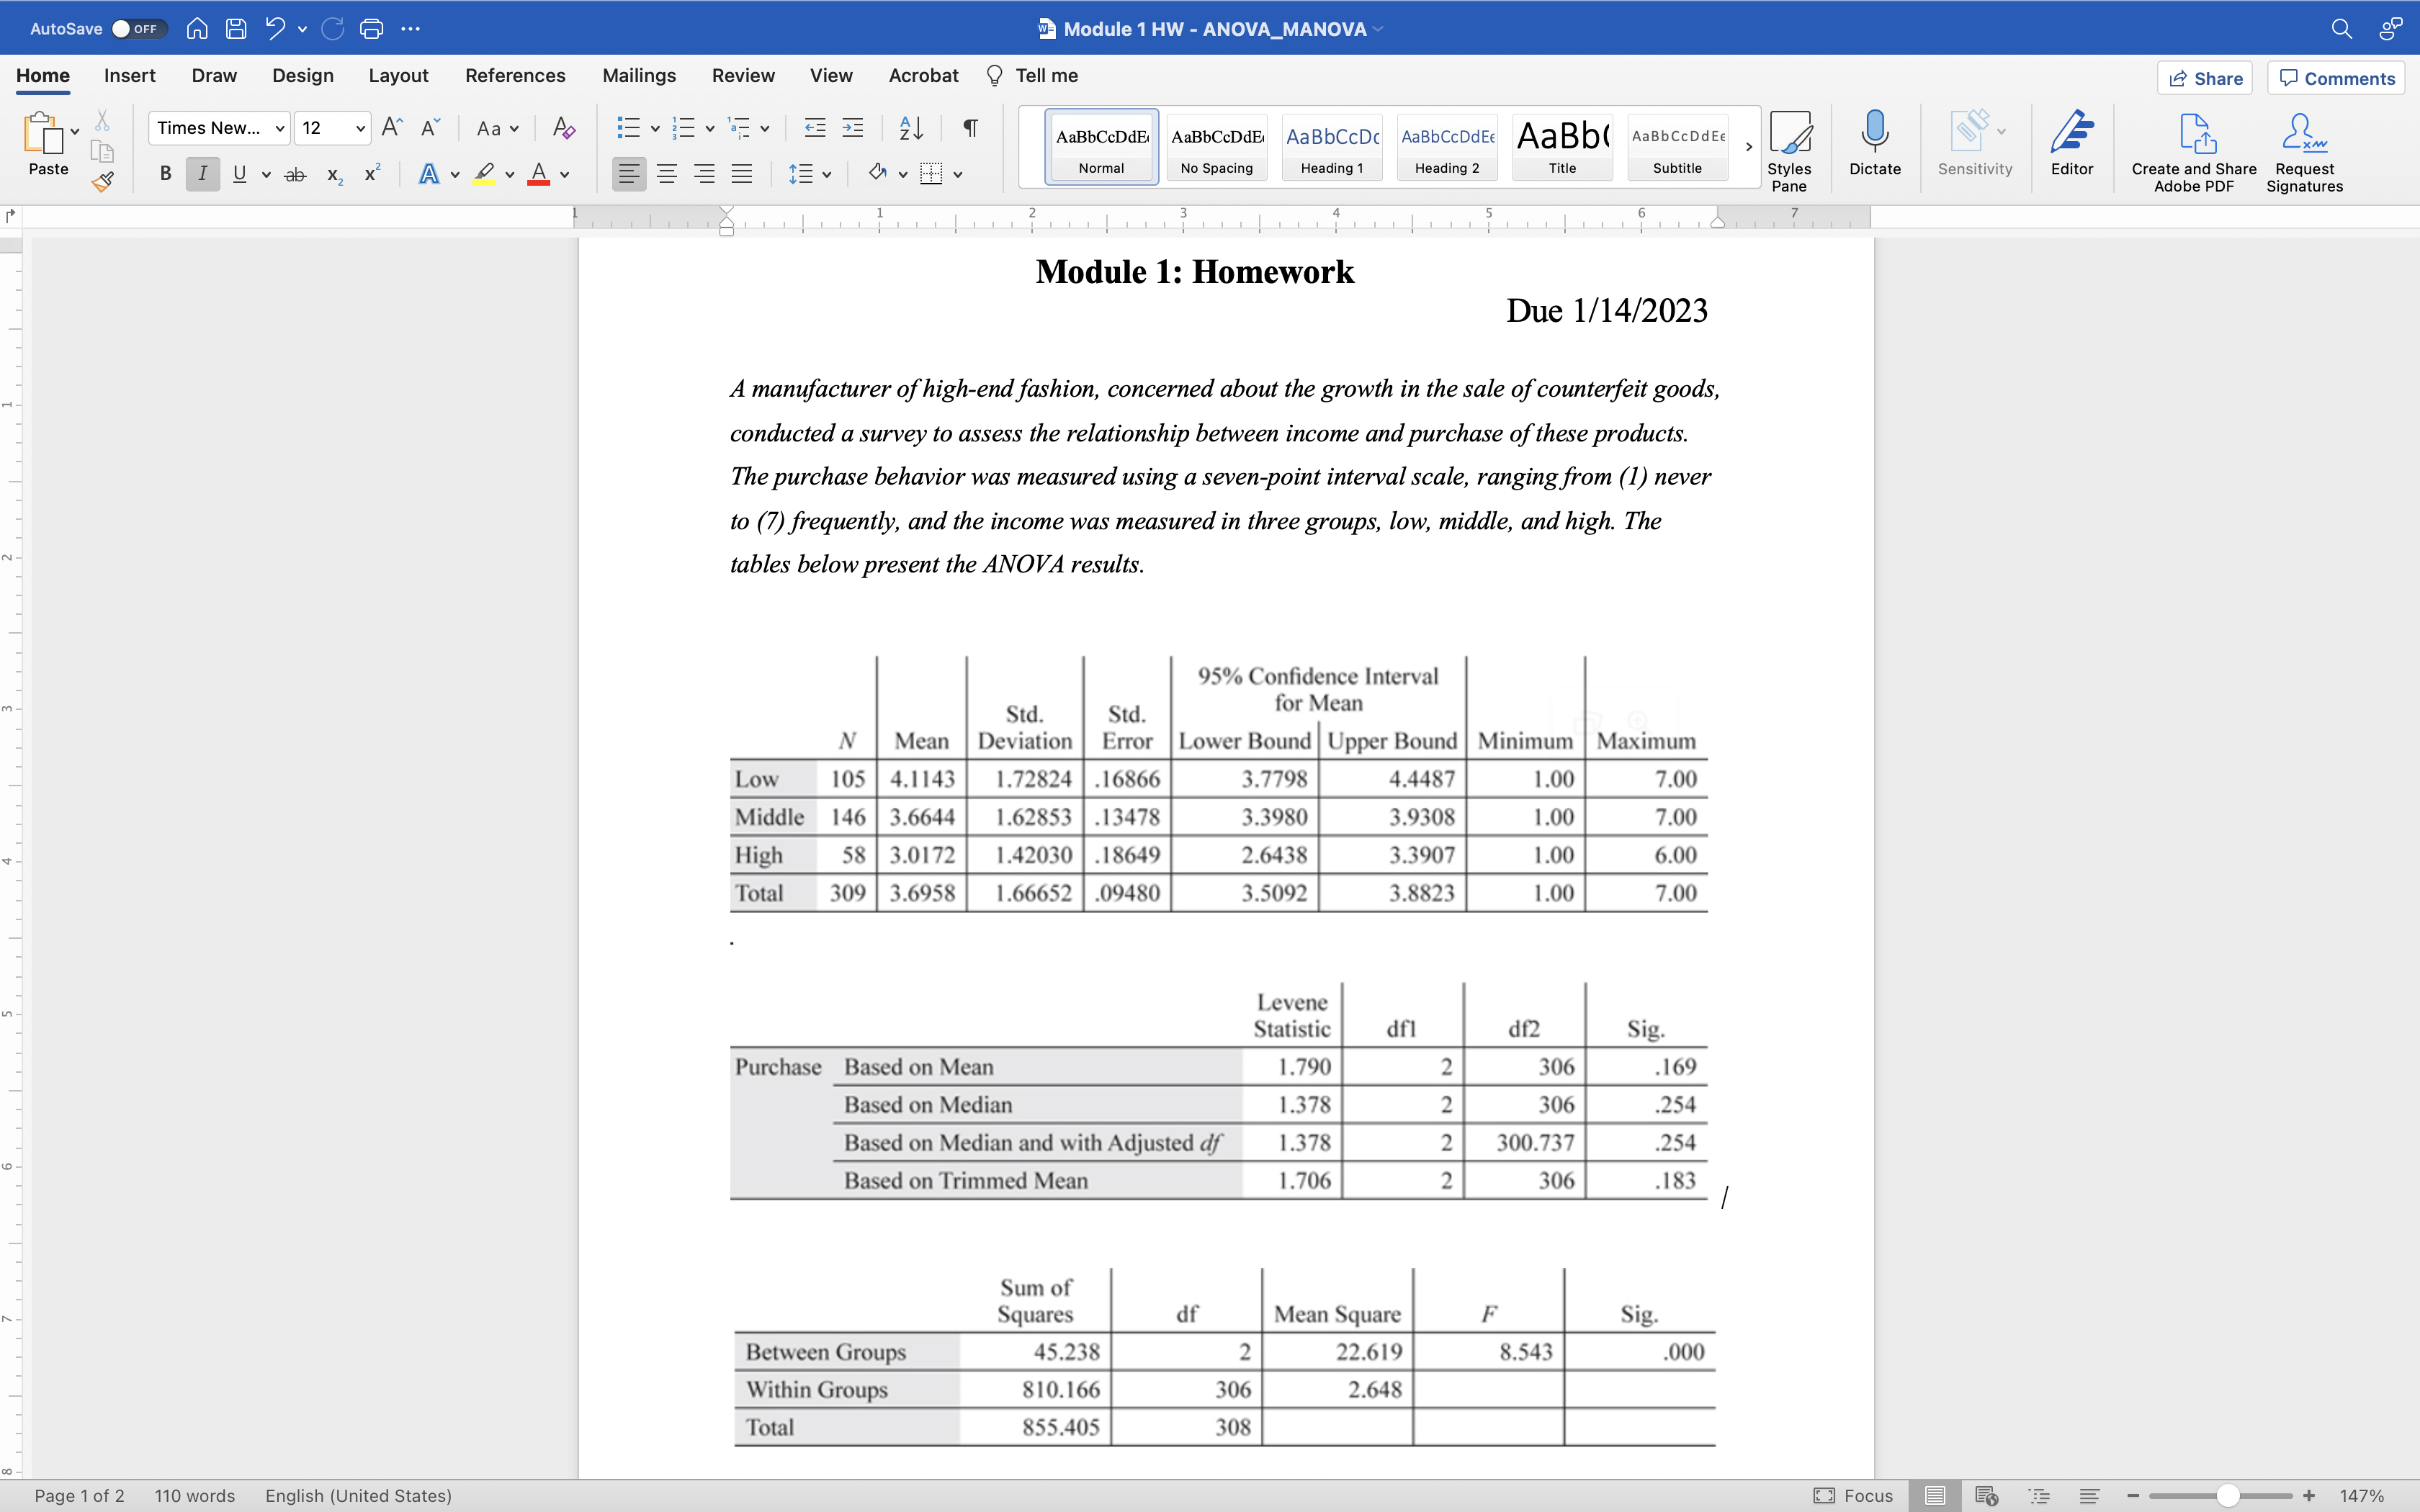
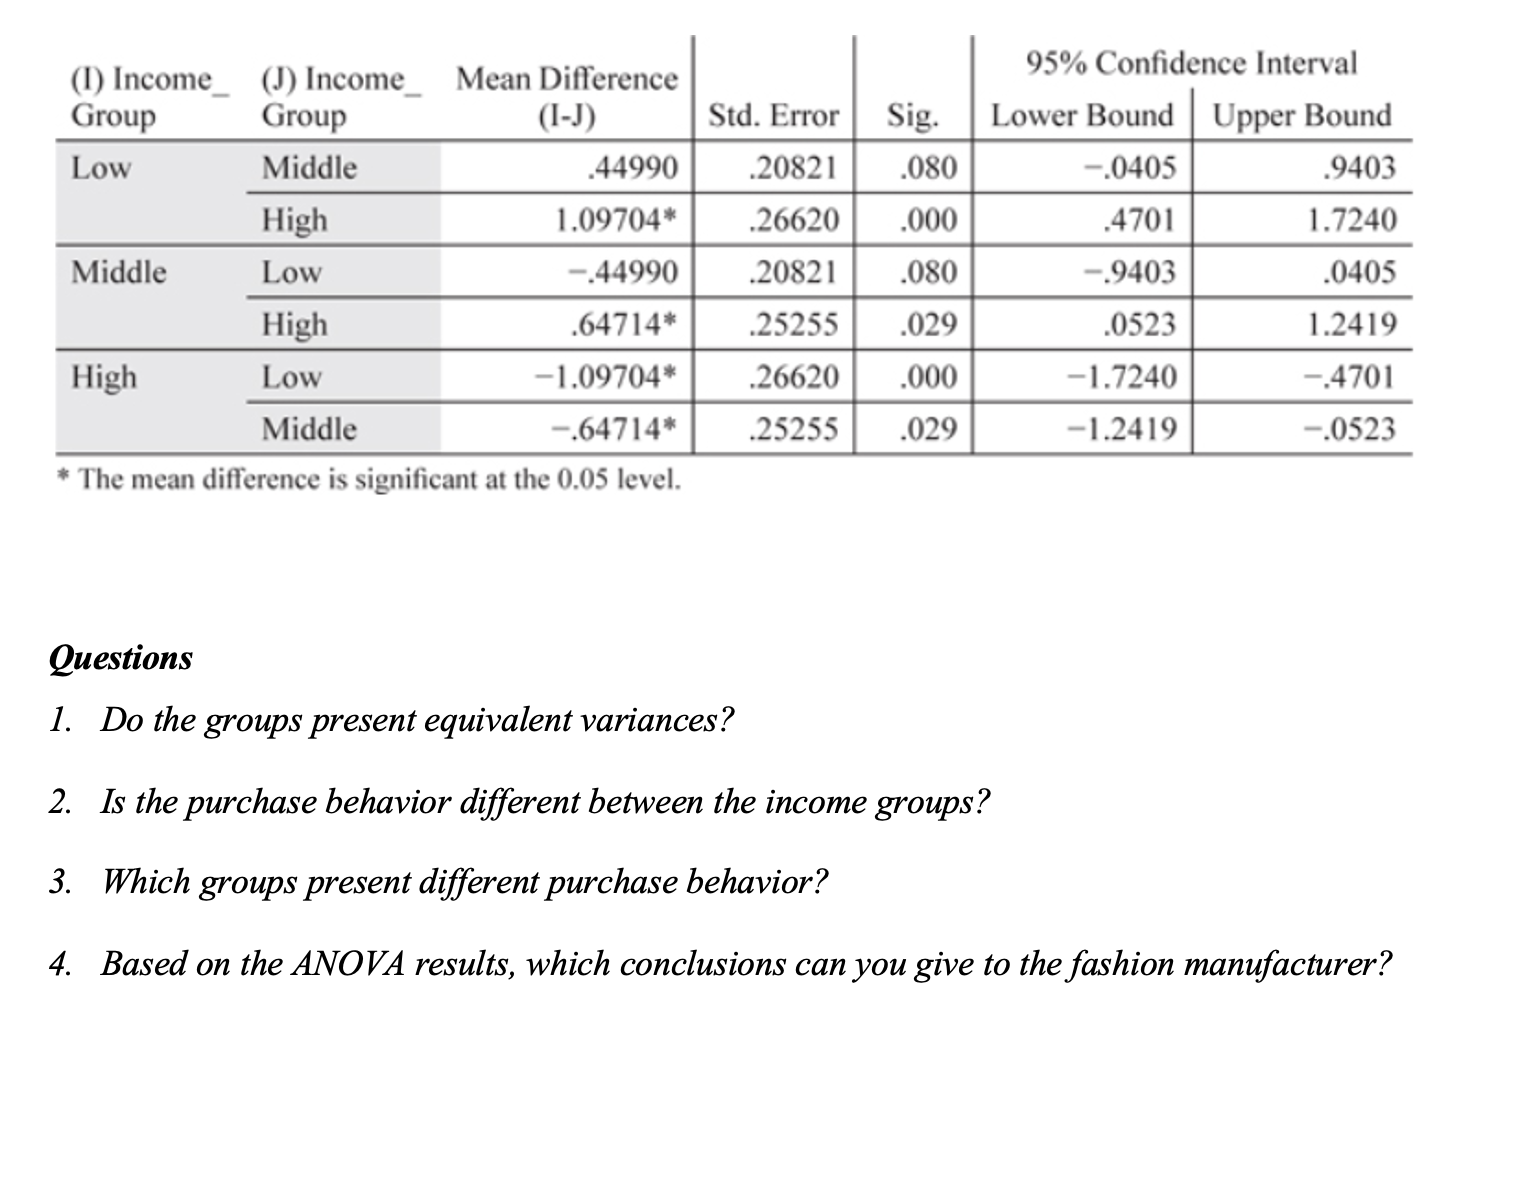
AutoSave OFF A A ? CG ... Module 1 HW - ANOVA_MANOVA Home Insert Draw Design Layout References Mailings Review View Acrobat Tell me Share Comments Times New... v 12 A A Aav AaBbCcDdE AaBbCcDdE AaBbCcDc AaBbCcDdEE AaBb( AaBbCCDdEE Paste BIUvab XX ADAv Normal No Spacing Heading 1 Heading 2 Title Subtitle Styles Dictate Sensitivity Editor Create and Share Request pane Adobe PDF Signatures Module 1: Homework Due 1/14/2023 A manufacturer of high-end fashion, concerned about the growth in the sale of counterfeit goods, conducted a survey to assess the relationship between income and purchase of these products. The purchase behavior was measured using a seven-point interval scale, ranging from (1) never to (7) frequently, and the income was measured in three groups, low, middle, and high. The tables below present the ANOVA results. 95% Confidence Interval Std Std for Mear N Mean Deviation Error Lower Bound Upper Bound Minimum Maximum Low 105 4.1143 1.72824 .16866 3.7798 4.4487 .00 7.00 Middle 146 3.6644 1.62853 .13478 3.3980 3.9308 1.0 7.00 High 58 3.0172 1.42030 .18649 2.6438 3.3907 1.00 6.00 Total 309 3.6958 1.66652 .09480 3.5092 3.8823 1.00 7.00 Levene Statistic dfl df2 Sig. Purchase Based on Mean 1.790 2 306 169 Based on Median 1.378 306 254 Based on Median and with Adjusted df 1.378 300.737 254 NN Based on Trimmed Mean 1.706 306 183 Sum of Squares df Mean Square F Sig. Between Groups 45.238 2 22.619 8.543 000 Within Groups 810.166 306 2.648 Total 855.405 308 Page 1 of 2 110 words English (United States) Focus E + 147%(1) Income_(J) Income Mean Difference 95% Confidence Interval Group Group (I-J) Std. Error Sig. Lower Bound Upper Bound Low Middle .44990 20821 .080 -.0405 .9403 High 1.09704* 26620 .000 4701 1.7240 Middle Low -.44990 .20821 .080 -.9403 .0405 High .64714* .25255 .029 .0523 1.2419 High Low -1.09704* 26620 .000 -1.7240 -.4701 Middle -.64714* 25255 .029 -1.2419 -.0523 * The mean difference is significant at the 0.05 level. Questions 1. Do the groups present equivalent variances? 2. Is the purchase behavior different between the income groups? 3. Which groups present different purchase behavior? 4. Based on the ANOVA results, which conclusions can you give to the fashion manufacturer
Step by Step Solution
There are 3 Steps involved in it

Get step-by-step solutions from verified subject matter experts