

Question: AutoSave OFF A A FG ... 3 QUA2343 - Assignment 2 Home Insert Draw Page Layout Formulas Data Review View Automate ? Tell me Comments
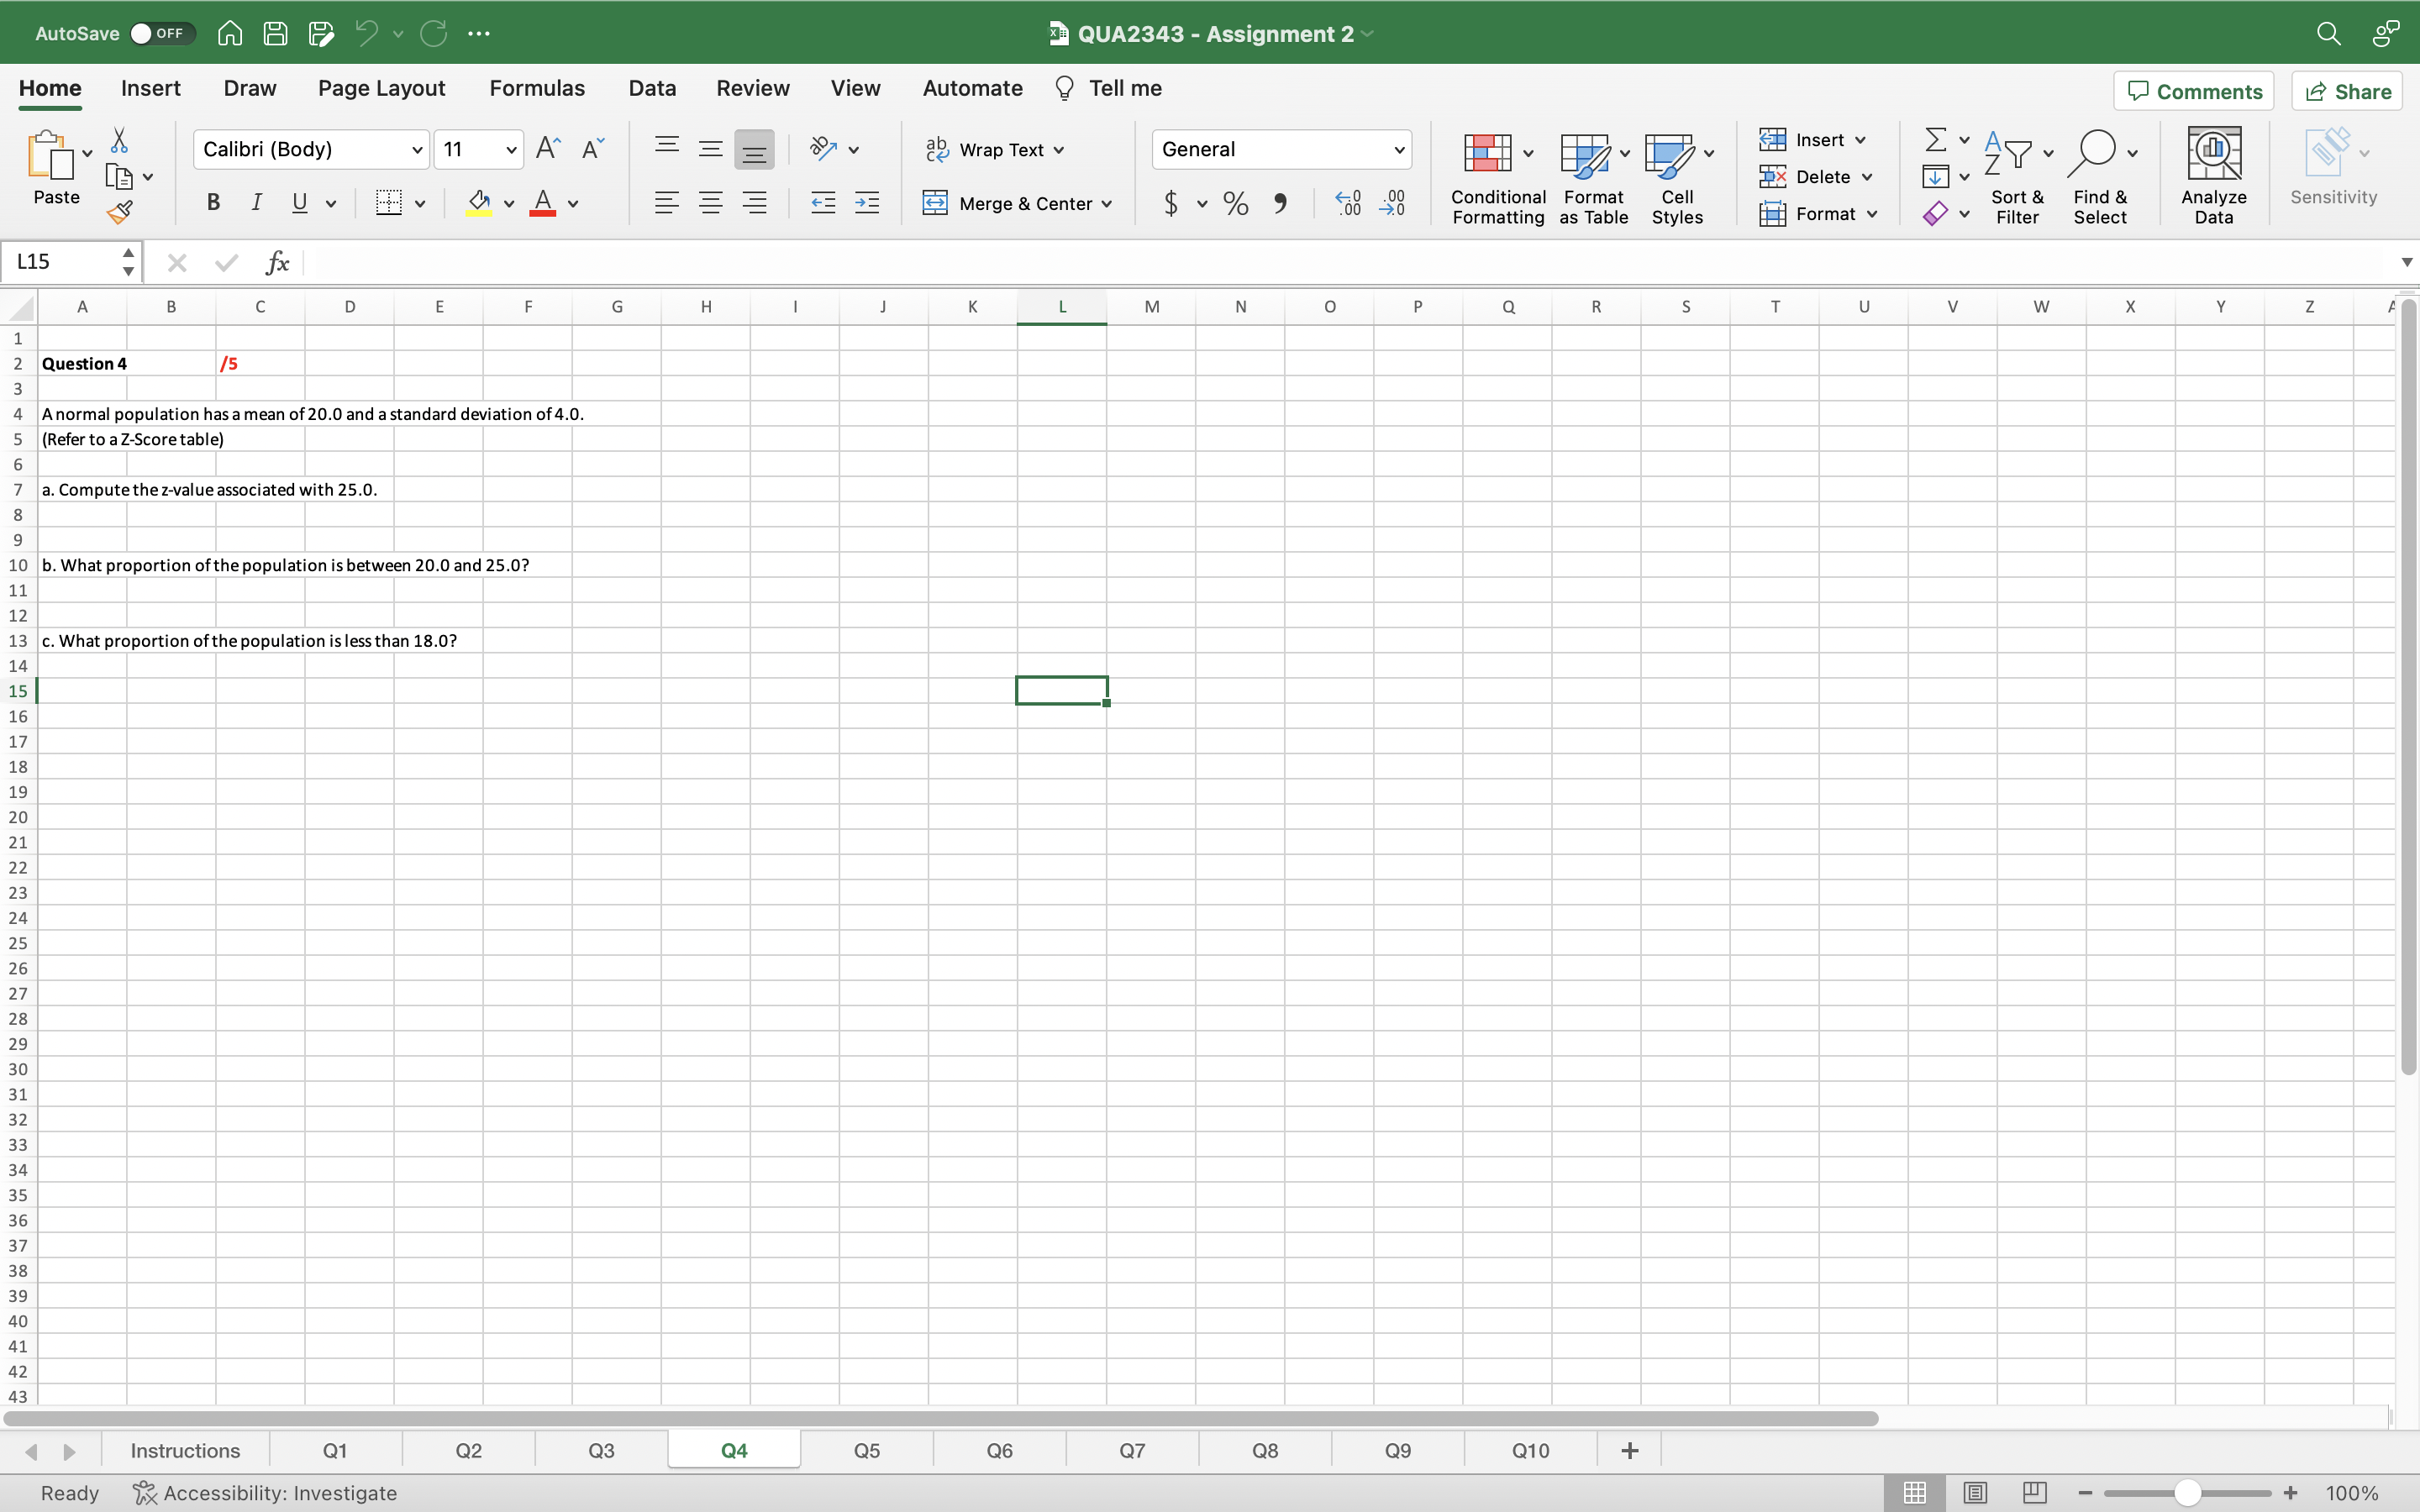
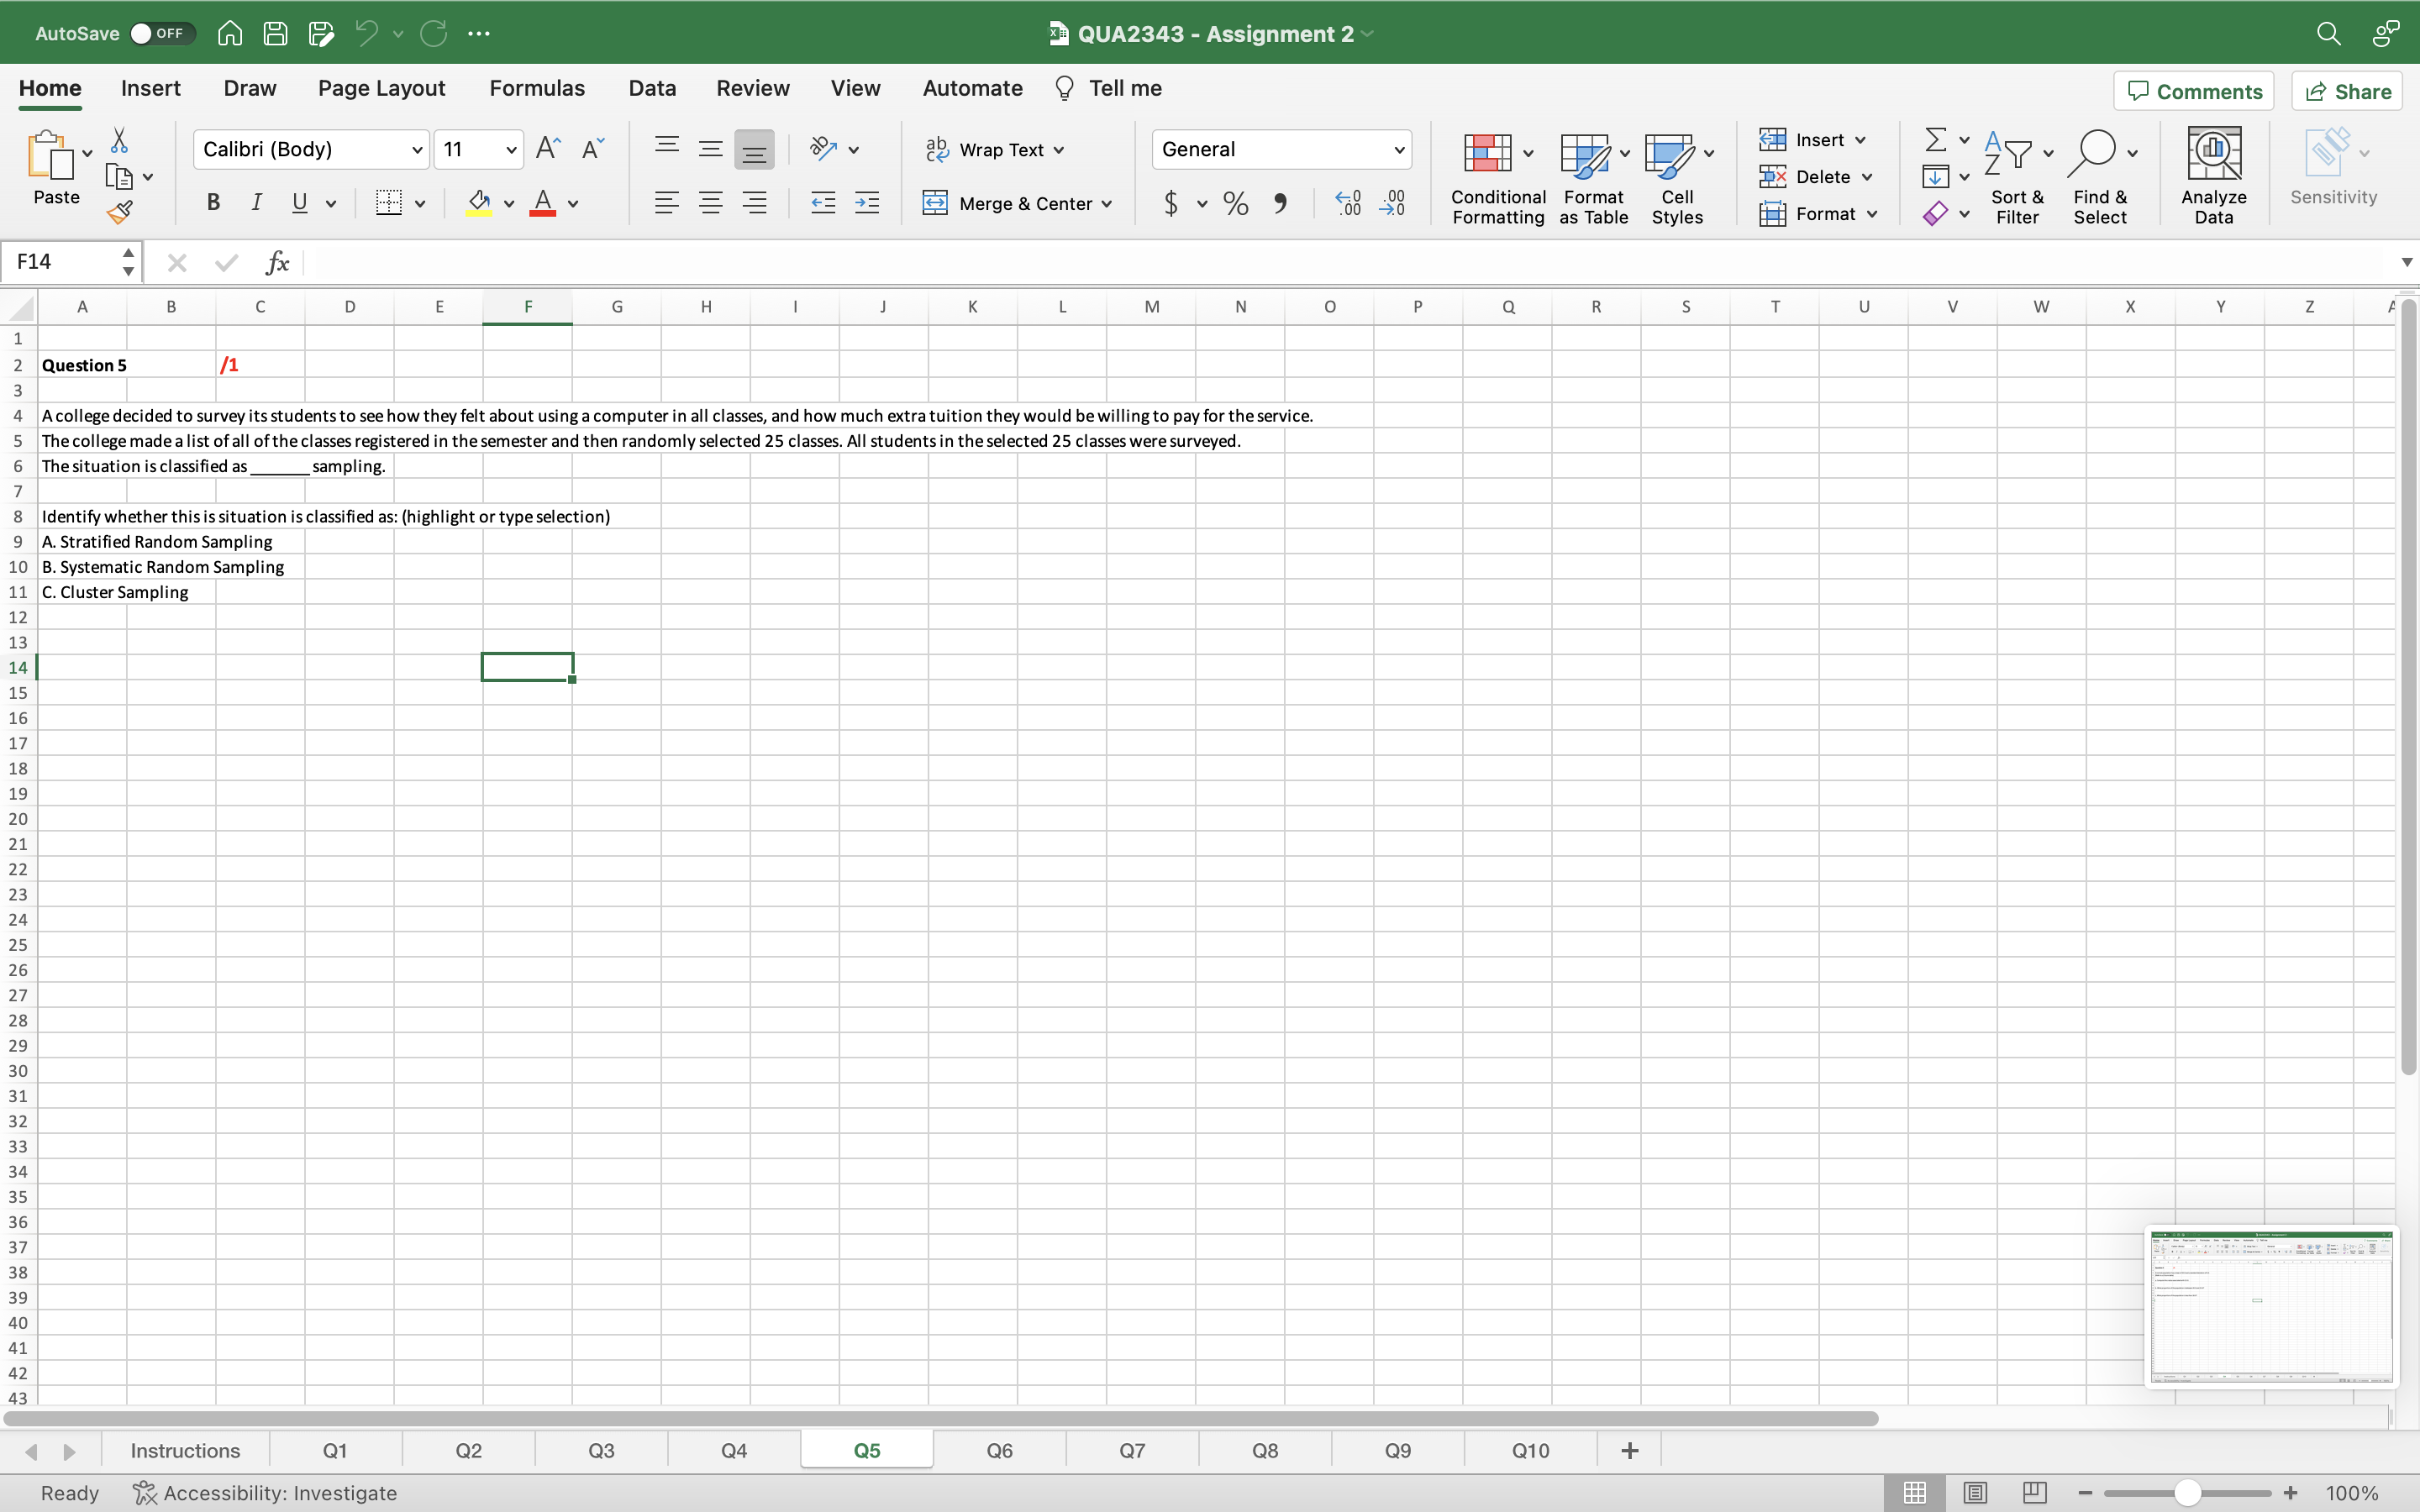
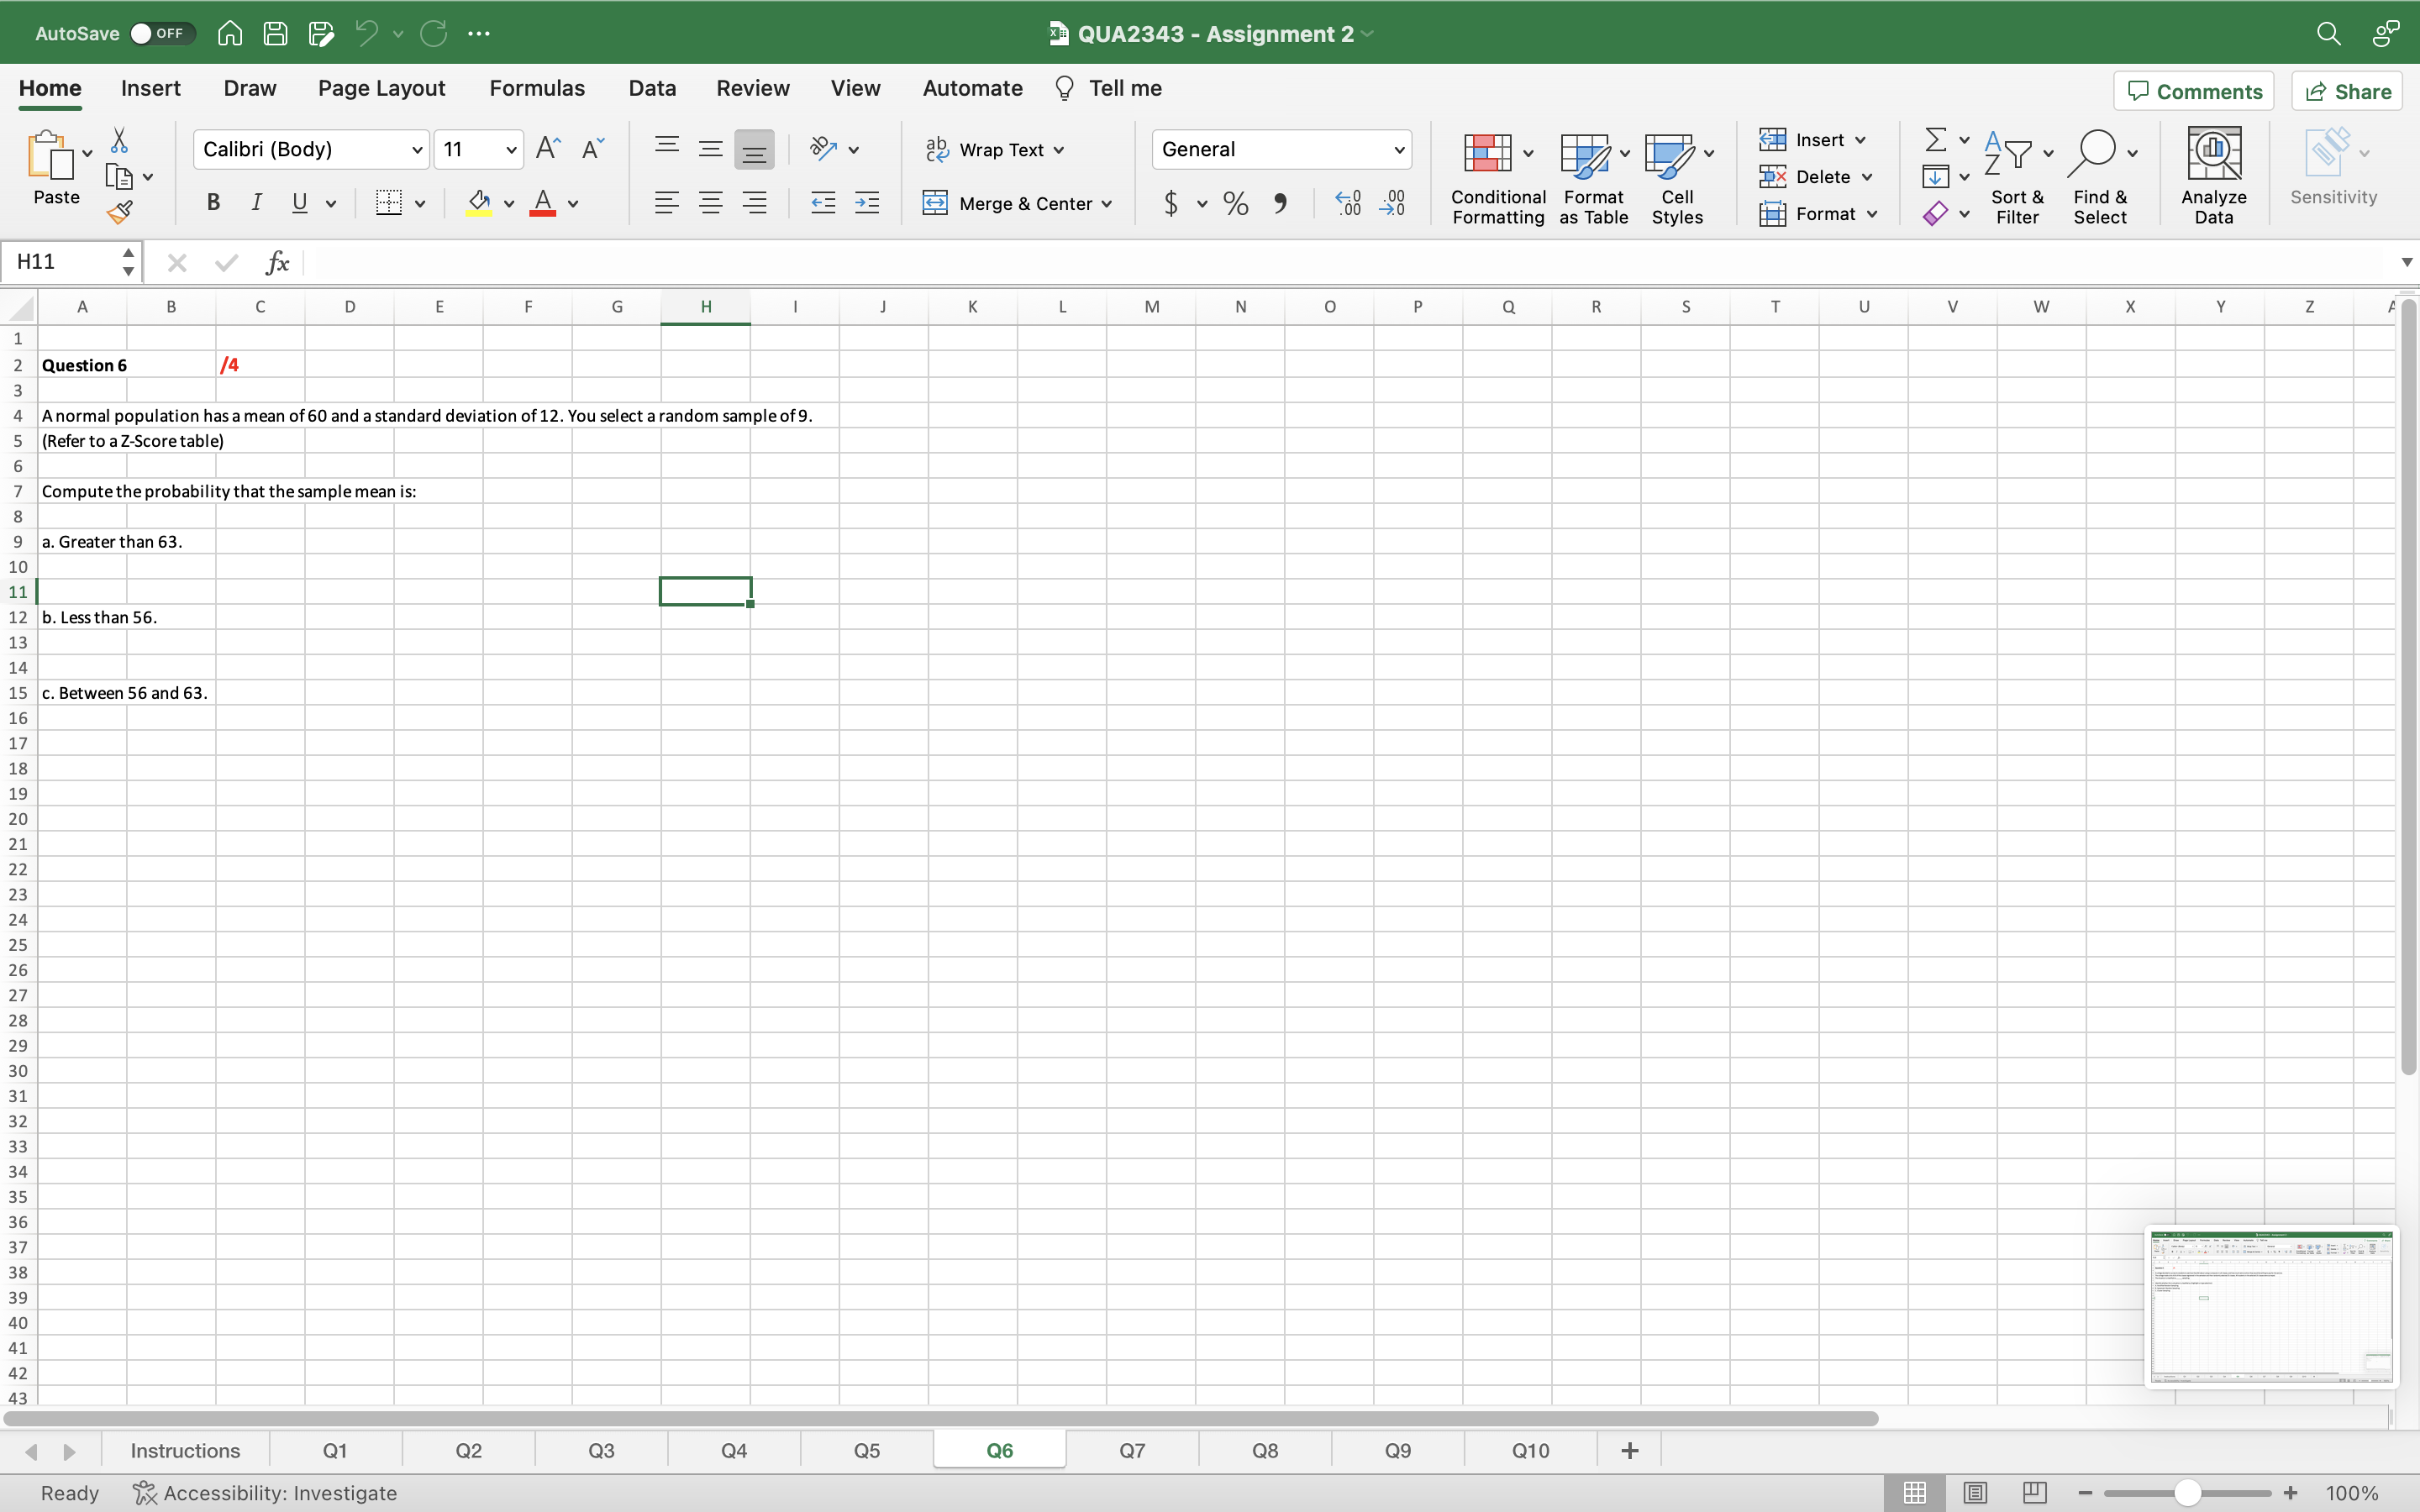
AutoSave OFF A A FG ... 3 QUA2343 - Assignment 2 Home Insert Draw Page Layout Formulas Data Review View Automate ? Tell me Comments Share Calibri (Body) v 11 AA ab Wrap Text General Insert v Ex AY- O. Ex Delete Paste BIUV DVAv E E Merge & Center v $ ~ % " Conditional Format Cell Sort & Find & Analyze Sensitivity Formatting as Table Styles Format v Filter Select Data L15 fx B C D E F G H 1 J K L M N 0 P Q R S T U V w X Z Question 4 /5 A normal population has a mean of 20.0 and a standard deviation of 4.0. 5 (Refer to a Z-Score table) a. Compute the z-value associated with 25.0. O 10 b. What proportion of the population is between 20.0 and 25.0? 11 12 13 c. What proportion of the population is less than 18.0? 14 15 16 18 19 20 21 22 39 40 41 42 43 D Instructions Q1 Q2 Q3 Q4 Q5 Q6 Q7 Q8 Q9 Q10 + Ready Accessibility: Investigate + 100%AutoSave OFF A A FG ... 3 QUA2343 - Assignment 2 Home Insert Draw Page Layout Formulas Data Review View Automate ? Tell me Comments Share Calibri (Body) v 11 AA Wrap Text General Insert Ex AY- O. Ex Delete Paste BIUV DVAv E Merge & Center v $ ~ % " Conditional Format Cell Sort & Find & Analyze Sensitivity Formatting as Table Styles Format v Filter Select Data F14 fx B C D E F G H 1 J K L M N 0 P Q R S T U V w X Z N N Question 5 /1 4 A college decided to survey its students to see how they felt about using a computer in all classes, and how much extra tuition they would be willing to pay for the service. 5 The college made a list of all of the classes registered in the semester and then randomly selected 25 classes. All students in the selected 25 classes were surveyed. The situation is classified as _ sampling. 7 8 Identify whether this is situation is classified as: (highlight or type selection) 9 A. Stratified Random Sampling 10 B. Systematic Random Sampling 11 C. Cluster Sampling 12 13 14 15 16 17 18 19 20 21 38 39 40 41 43 Instructions Q1 Q2 Q3 Q4 Q5 Q6 Q7 Q8 Q9 Q10 + Ready Accessibility: Investigate + 100%AutoSave OFF A A FG ... 3 QUA2343 - Assignment 2 Home Insert Draw Page Layout Formulas Data Review View Automate ? Tell me Comments Share Calibri (Body) v 11 AA ab Wrap Text v General Insert Ex AY- O. Ex Delete Paste BIUV DVAv E Merge & Center v $ ~ % " Conditional Format Cell Sort & Find & Analyze Sensitivity Formatting as Table Styles Format v Filter Select Data H11 fx B C D E F G H 1 J K L M N 0 P Q R S T U V w X Z Question 6 /4 A normal population has a mean of 60 and a standard deviation of 12. You select a random sample of 9. (Refer to a Z-Score table) Compute the probability that the sample mean is: a. Greater than 63. 10 11 12 b. Less than 56. 13 14 15 c. Between 56 and 63. 16 17 18 19 20 21 22 23 24 25 26 27 38 39 40 41 43 Instructions Q1 Q2 Q3 Q4 Q5 Q6 Q7 Q8 Q9 Q10 + Ready Accessibility: Investigate + 100%
Step by Step Solution
There are 3 Steps involved in it

Get step-by-step solutions from verified subject matter experts