

Question: AutoSave OFF A H . CGP ... Assignment 4 Fall 2021 - Compatibility Mode Home Insert Draw Design Layout References Mailings Review View Tell me
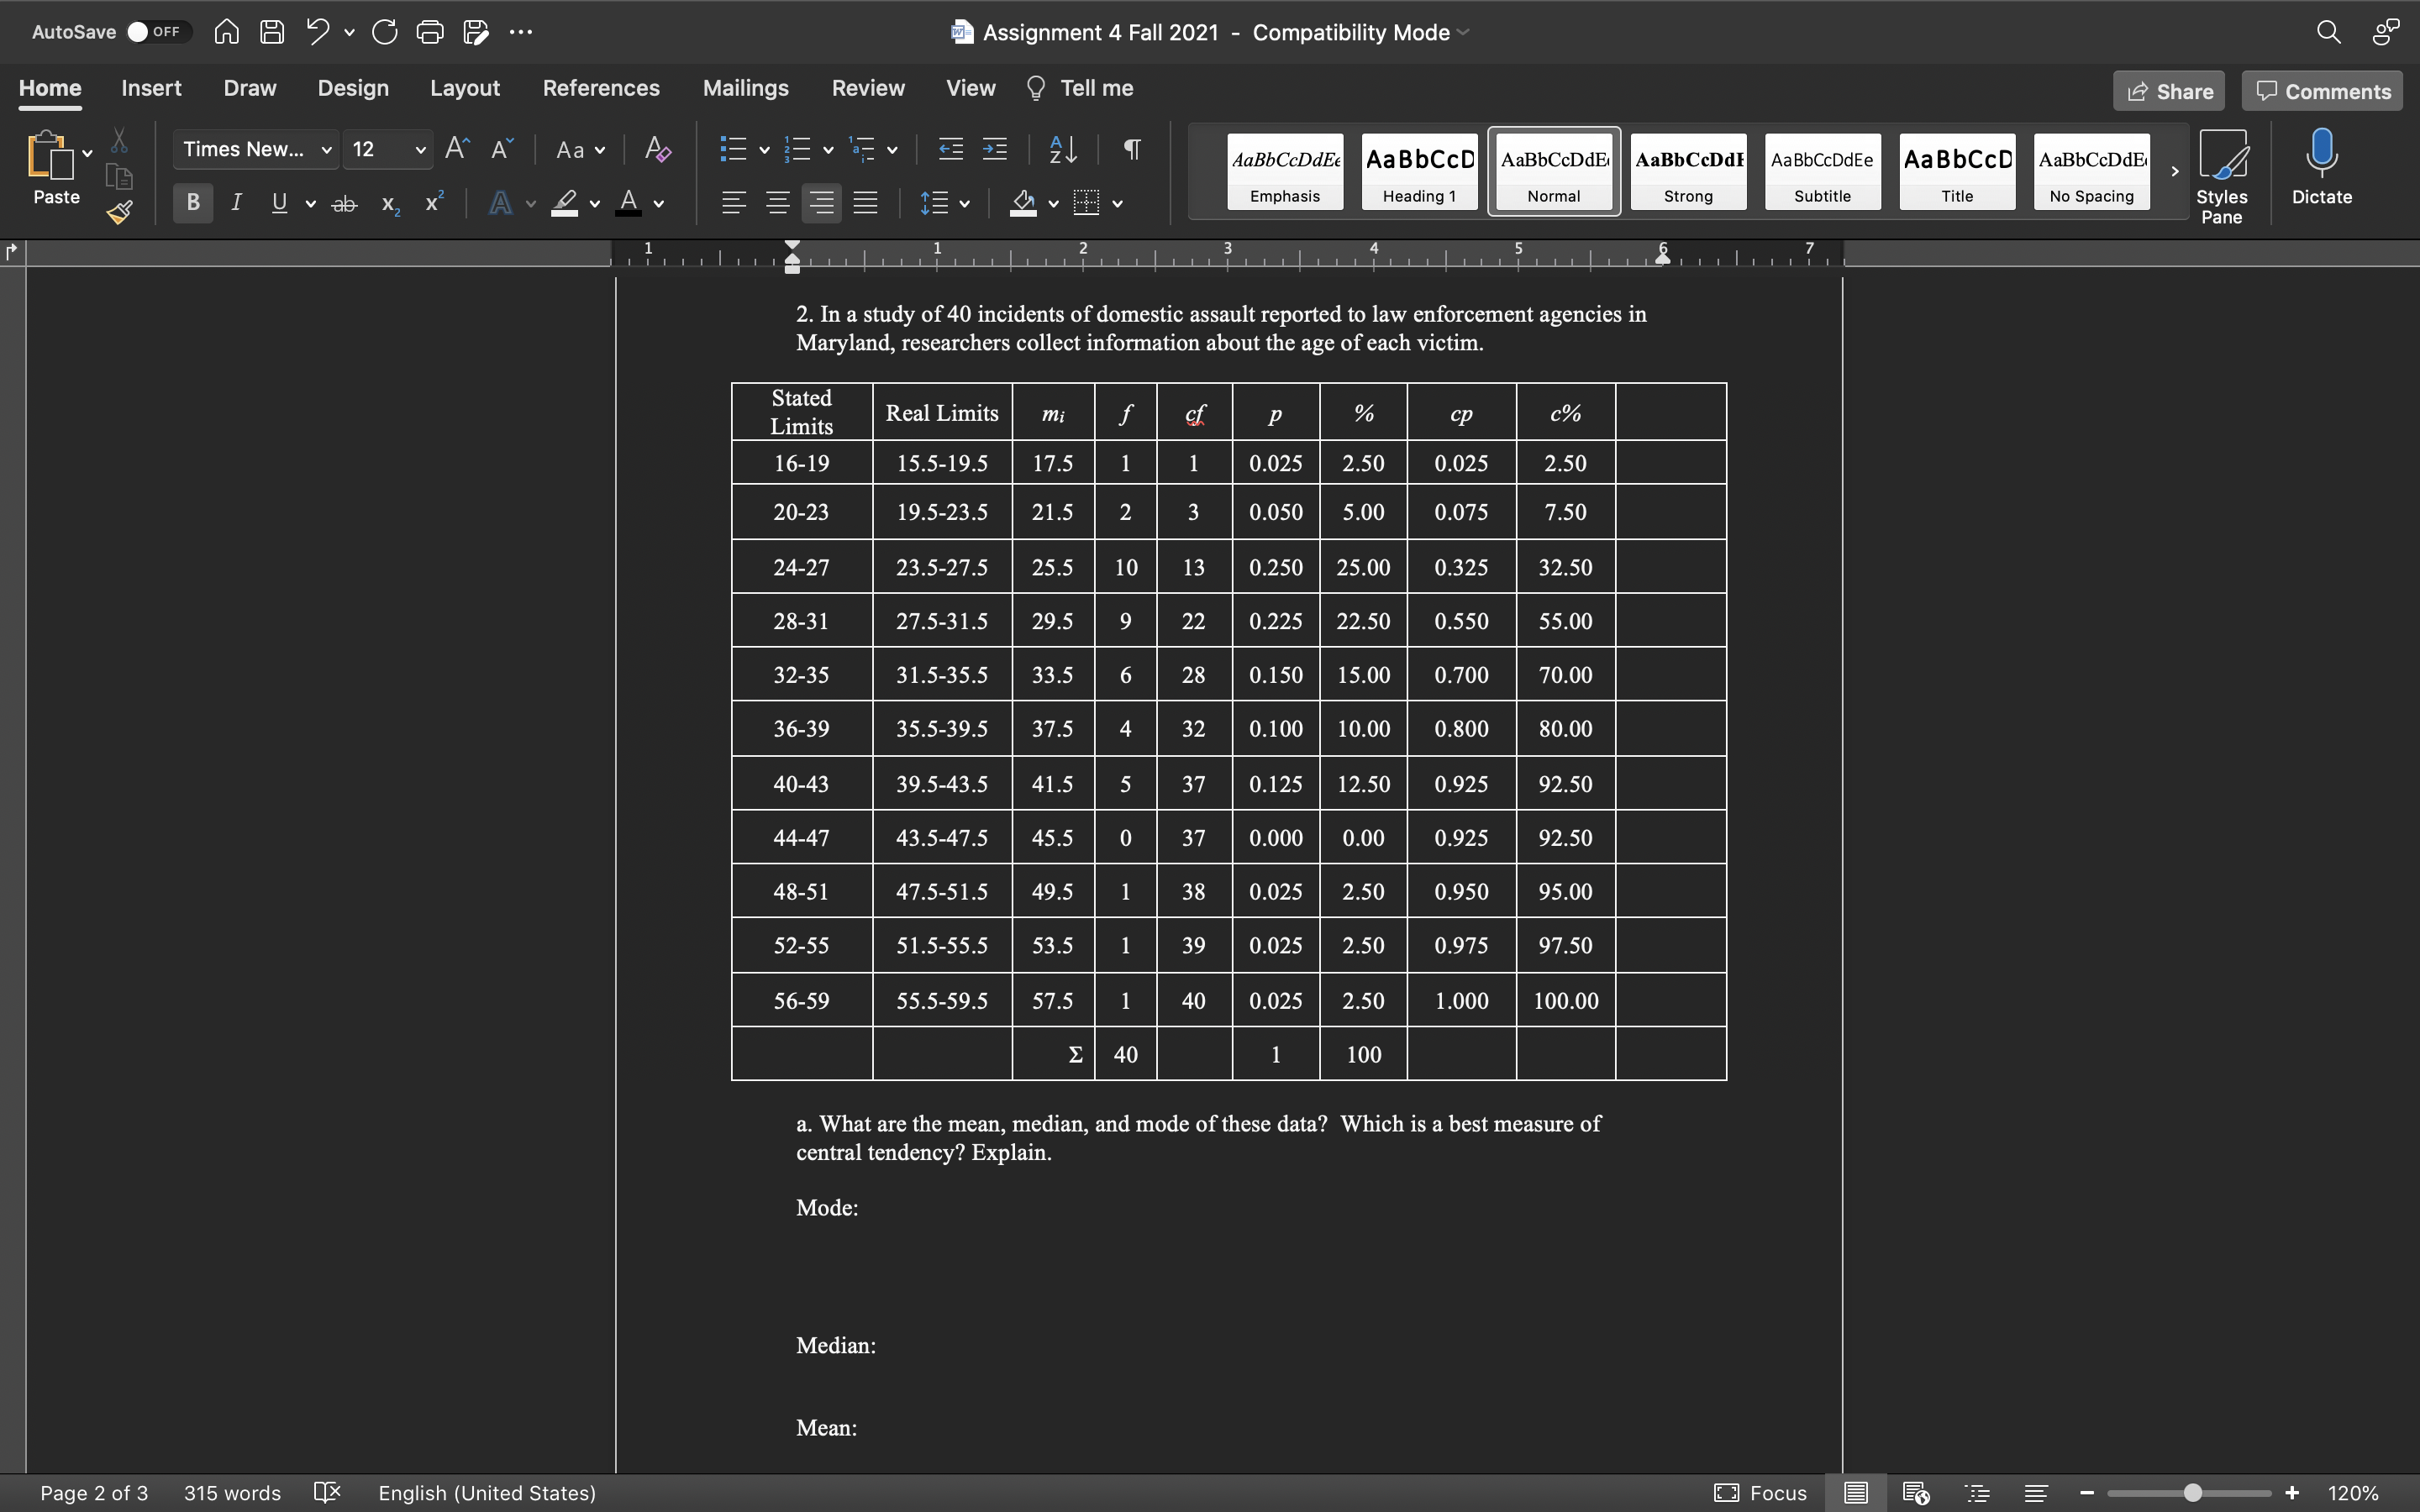
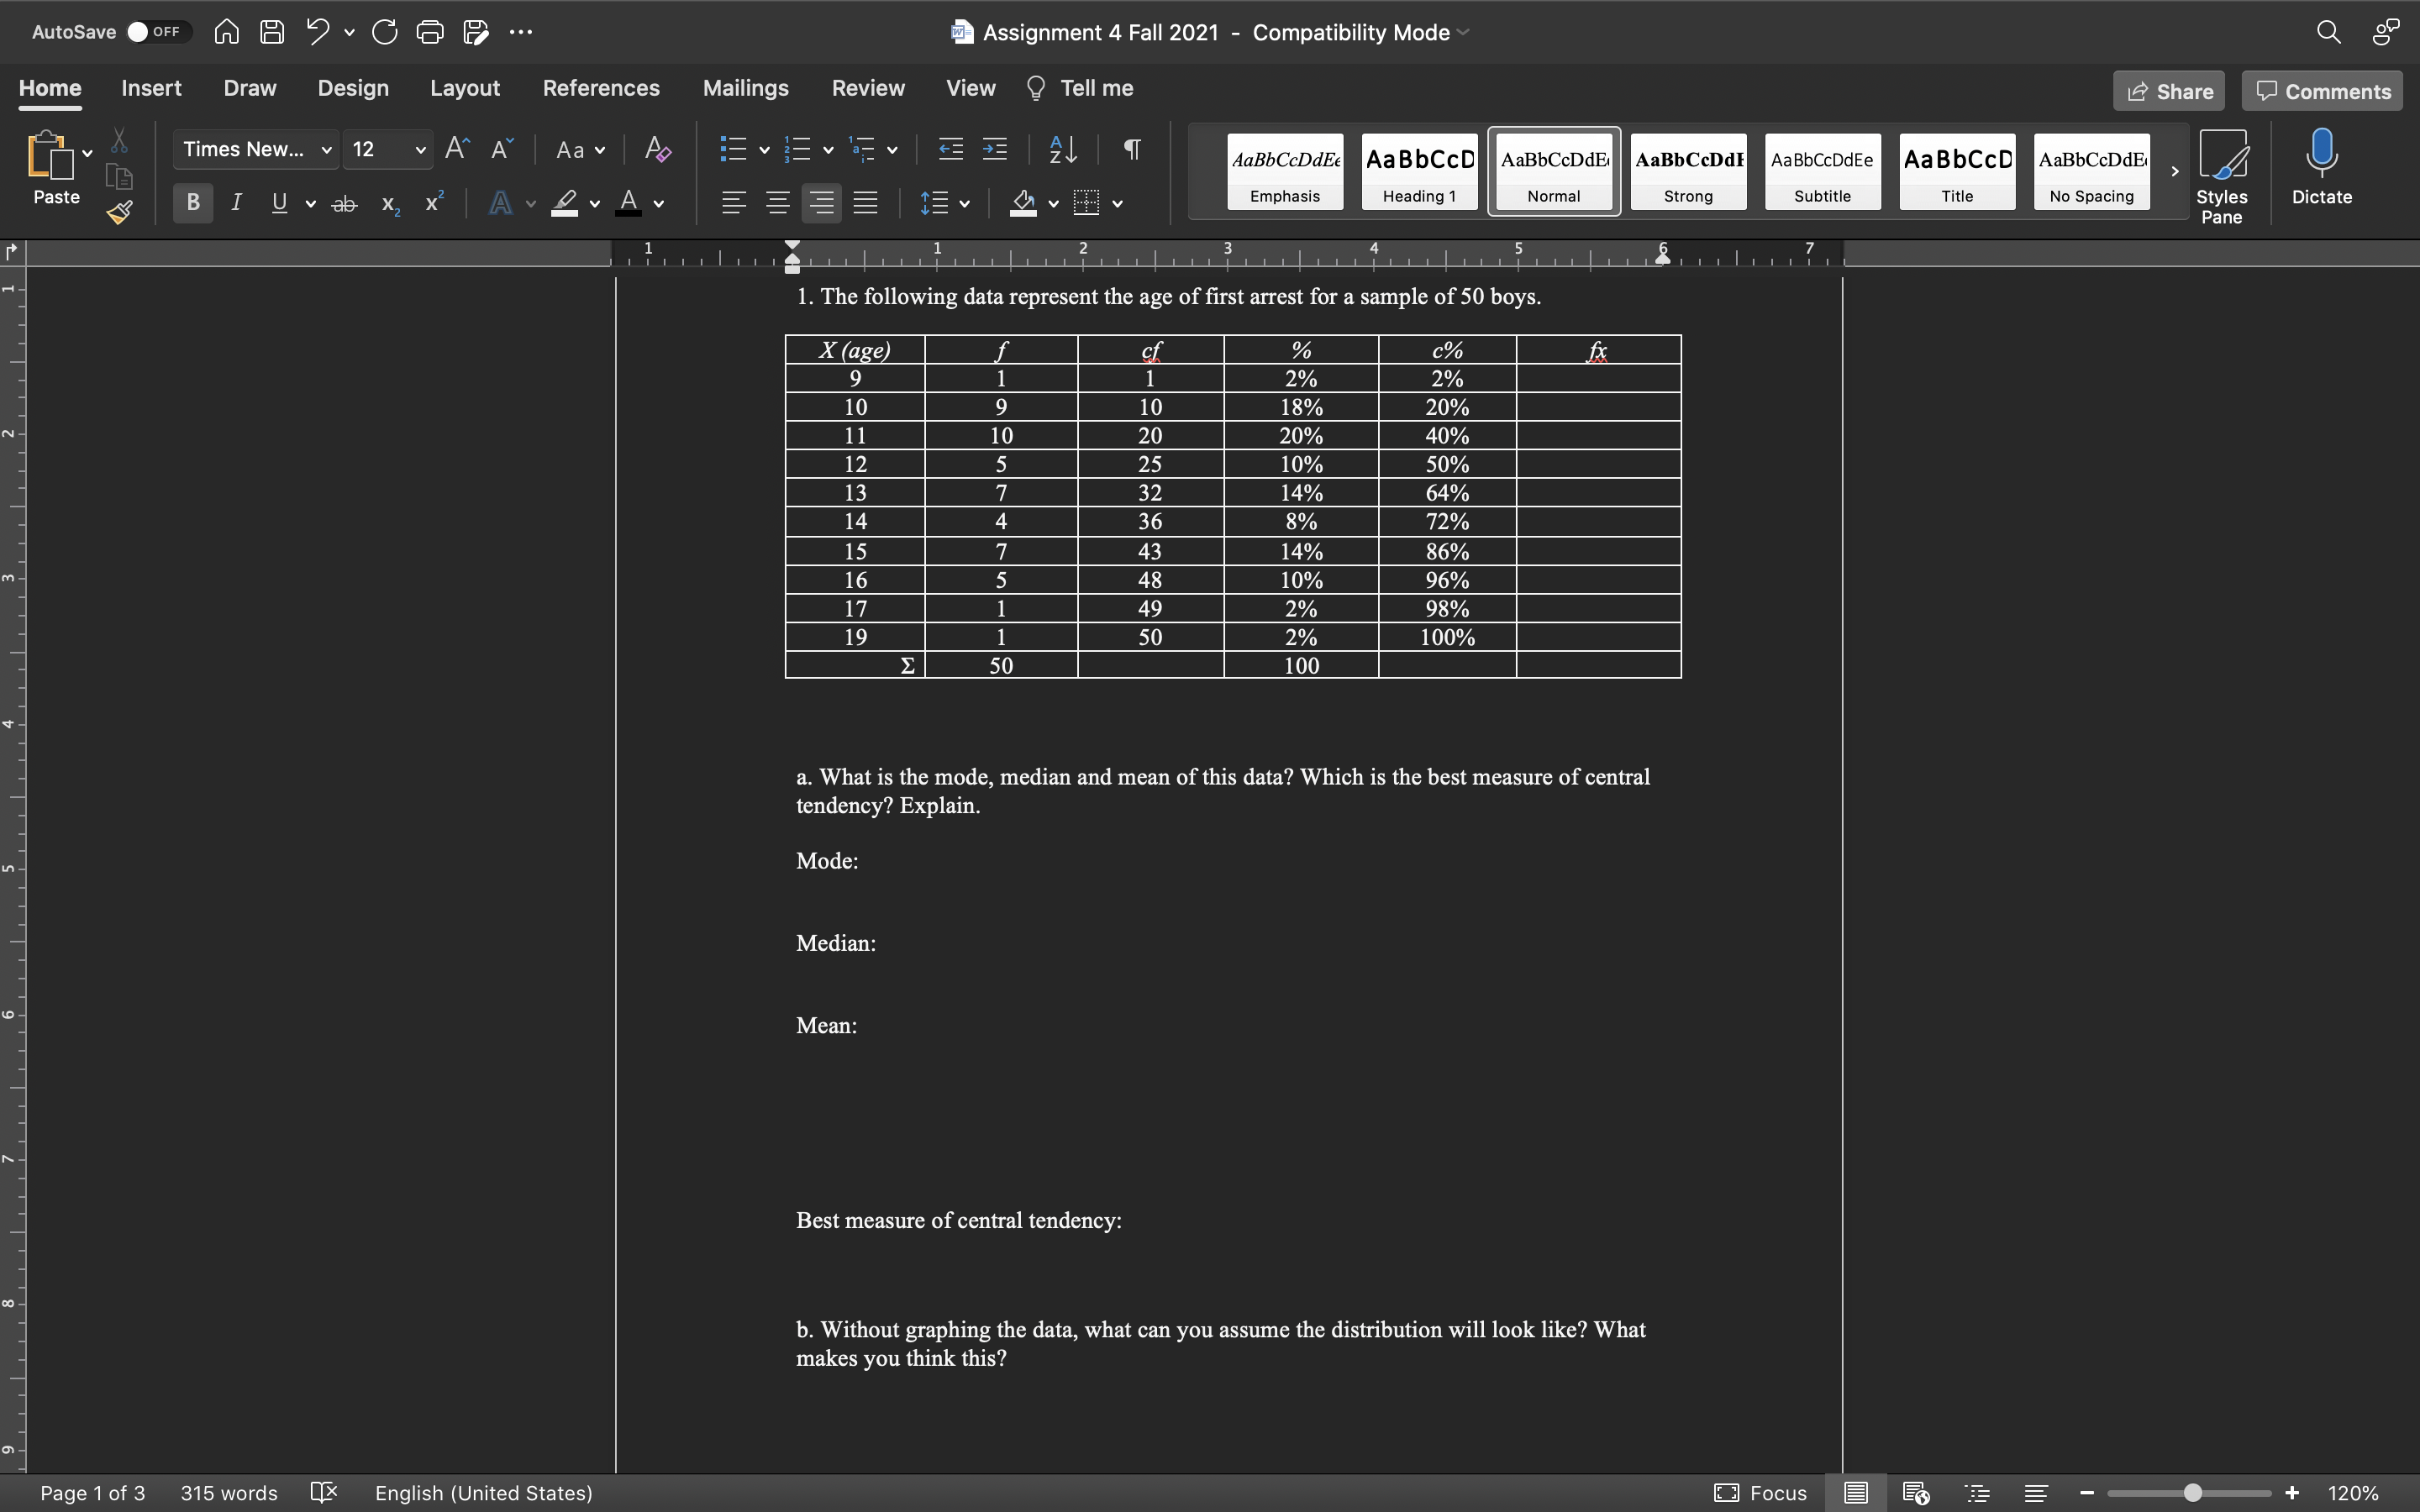
AutoSave OFF A H . CGP ... Assignment 4 Fall 2021 - Compatibility Mode Home Insert Draw Design Layout References Mailings Review View Tell me Share Comments Times New... v 12 A A Aa v AL AaBbCcDdEE AaBbCCD AaBbCcDdE AaBbCcDdF AaBbCcDdEe AaBbCCD AaBbCcDdE leading 1 Normal Strong Subtitle Title No Spacing Styles Dictate Paste Emphasis B I Uv ab Av LV Av E Pane 2. In a study of 40 incidents of domestic assault reported to law enforcement agencies in Maryland, researchers collect information about the age of each victim. Stated mi cf cp CO Limits Real Limits 16-19 15.5-19.5 17.5 0.025 2.50 0.025 2.50 20-23 19.5-23.5 21.5 2 3 0.05 5.00 0.075 7.50 24-27 23.5-27.5 25.5 0.250 25.00 0.325 32.50 28-31 27.5-31.5 29.5 19 22 0.225 22.50 0.550 55.00 32-35 31.5-35.5 33.5 28 0.150 15.00 0.700 70.00 86-39 35.5-39.5 37.5 4 0.100 10.00 0.800 80.00 40-43 39.5-43.5 $1.5 5 37 0.125 12.50 0.925 92.50 44-47 43.5-47.5 45.5 37 0.000 0.00 0.925 92.50 48-51 47.5-51.5 49.5 38 0.02 2.50 0.950 95.00 52-55 51.5-55.5 53.5 39 0.02 2.50 0.975 97.50 56-59 55.5-59.5 57.5 40 0.025 2.50 1.000 100.00 100 a. What are the mean, median, and mode of these data? Which is a best measure of central tendency? Explain. Mode: Median: Mean: Page 2 of 3 315 words X Focus E + English (United States) 120%AutoSave OFF A H . CGP ... Assignment 4 Fall 2021 - Compatibility Mode Home Insert Draw Design Layout References Mailings Review View Tell me Share Comments Times New... v 12 A A Aa v AL AaBbCcDdEE AaBbCCD AaBbCcDdE AaBbCcDdF AaBbCcDdEe AaBbCCD AaBbCcDdE Paste B I Uv ab Av LV Av = Emphasis leading 1 Normal Strong Subtitle Title No Spacing Styles Dictate Pane 1. The following data represent the age of first arrest for a sample of 50 boys. X (age % co fx 9 2% 2% 10 19 10 18% 20% 11 10 20 20% 40% 12 5 25 10% 50% 13 32 14% 64% 14 4 36 8% 72% 15 7 43 14% 86% 16 48 10% 96% 17 49 2% 98% 19 1 50 2% 100% 3 50 100 a. What is the mode, median and mean of this data? Which is the best measure of central tendency? Explain. Mode: Median: Mean: Best measure of central tendency: b. Without graphing the data, what can you assume the distribution will look like? What makes you think this? Page 1 of 3 315 words English (United States) Focus E + 120%
Step by Step Solution
There are 3 Steps involved in it

Get step-by-step solutions from verified subject matter experts