

Question: AutoSave . OFF Book3 Q Home Insert Draw Page Layout Formulas Data Review View Tell me Share Comments v L& Connections el Clear Group Analysis
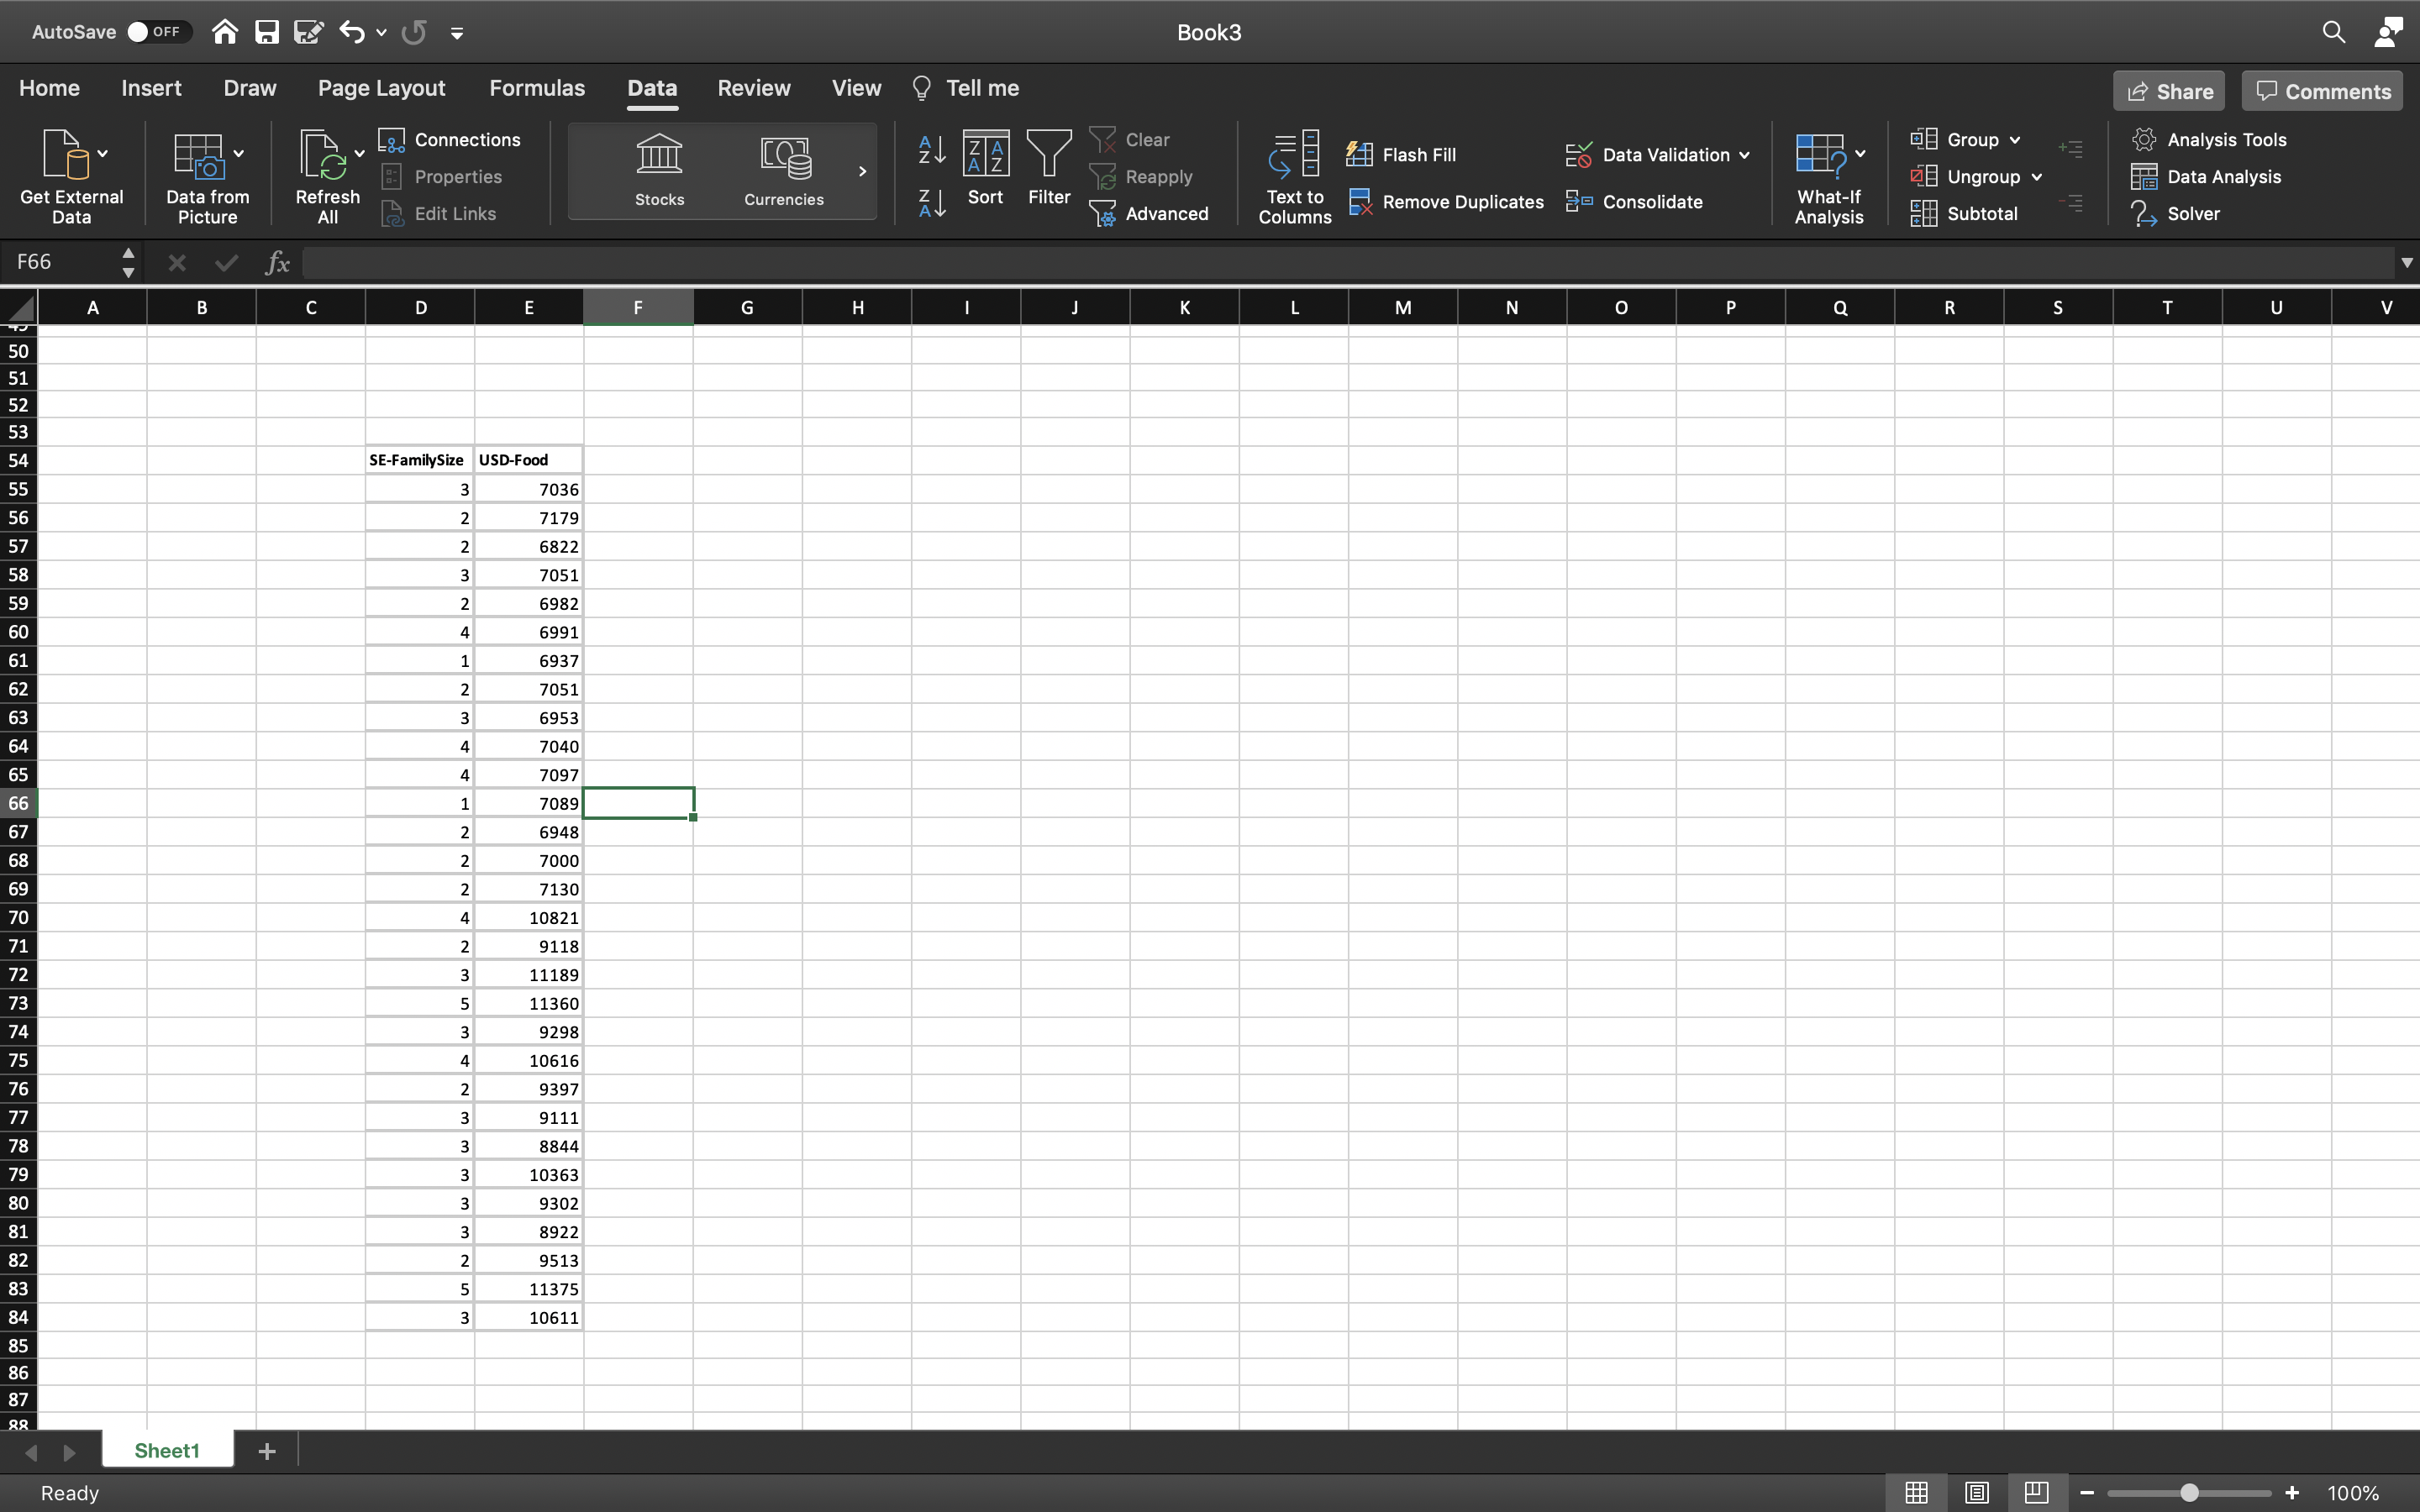
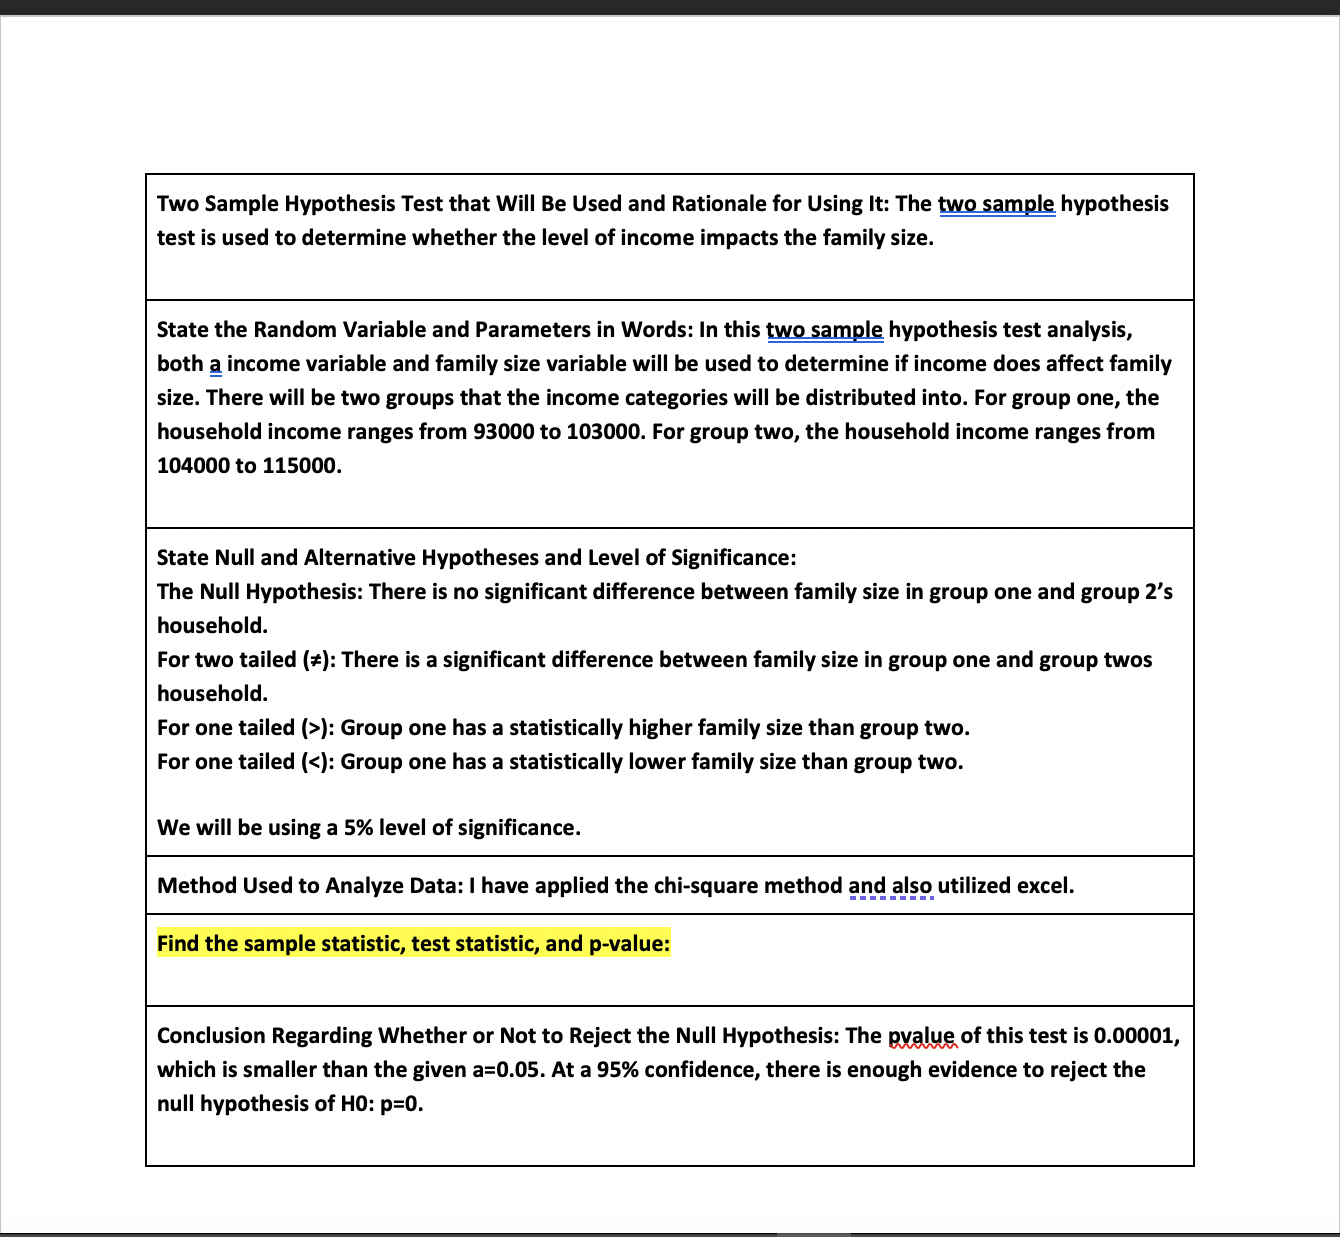
AutoSave . OFF Book3 Q Home Insert Draw Page Layout Formulas Data Review View Tell me Share Comments v L& Connections el Clear Group Analysis Tools Flash Fill Data Validation Properties Reapply Ungroup v Data Analysis Get External Data from Refresh Stocks Currencies Sort Filter Text to Ex Remove Duplicates Consolidate What-If Data Picture All Edit Links Advanced Columns Analysis Subtotal E ? Solver F66 X fx B C D E F G H M N P Q R S T U SE-FamilySize USD-Food 7036 7179 5822 7051 6982 6991 6937 7051 6953 7040 7097 7089 6948 7000 7130 W U N W W W W W N A W U W N A N N N H A A W N H A N W N N W 10821 91 18 11189 11360 9298 10616 9397 9111 8844 1036 9302 8922 9513 11375 10611 Sheet1 + Ready + 100%Two Sample Hypothesis Test that Will Be Used and Rationale for Using It: The hugmug hypothesis test is used to determine whether the level of income impacts the family size. State the Random Variable and Parameters in Words: In this twosmg hypothesis test analysis, both a income variable and family size variable will be used to determine if income does affect family size. There will be two groups that the income categories will be distributed into. For group one, the household income ranges from 93000 to 103000. For group two, the household income ranges from 104000 to 115000. State Null and Alternative Hypotheses and Level of Signicance: The Null Hypothesis: There is no signicant difference between family size in group one and group 2's household. For two tailed (at): There is a signicant difference between family size in group one and group twos household. For one tailed (>): Group one has a statistically higher family size than group two. For one tailed (
Step by Step Solution
There are 3 Steps involved in it

Get step-by-step solutions from verified subject matter experts