

Question: AutoSave Off File Get Data B3 11 12 13 14 15 16 17 18 Enter A Le From Web A 1 2 Rate 3
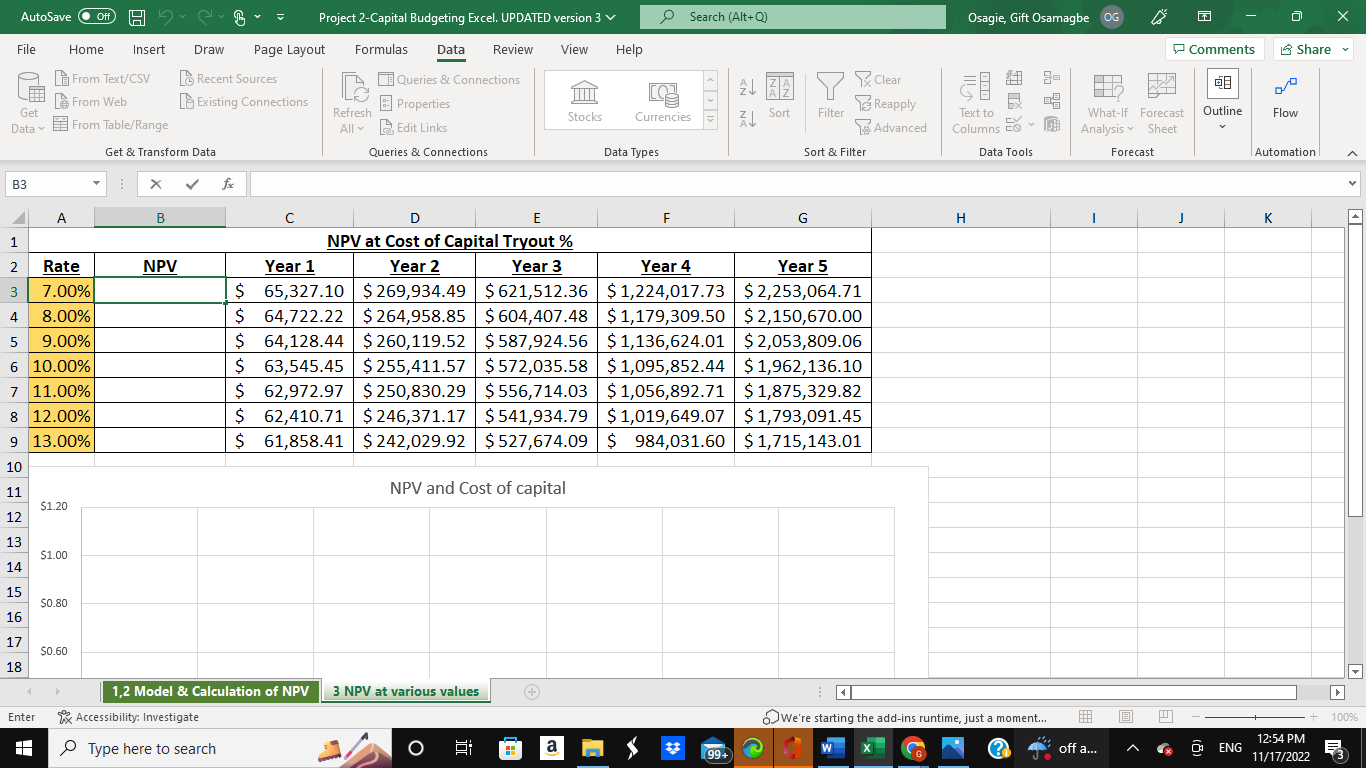
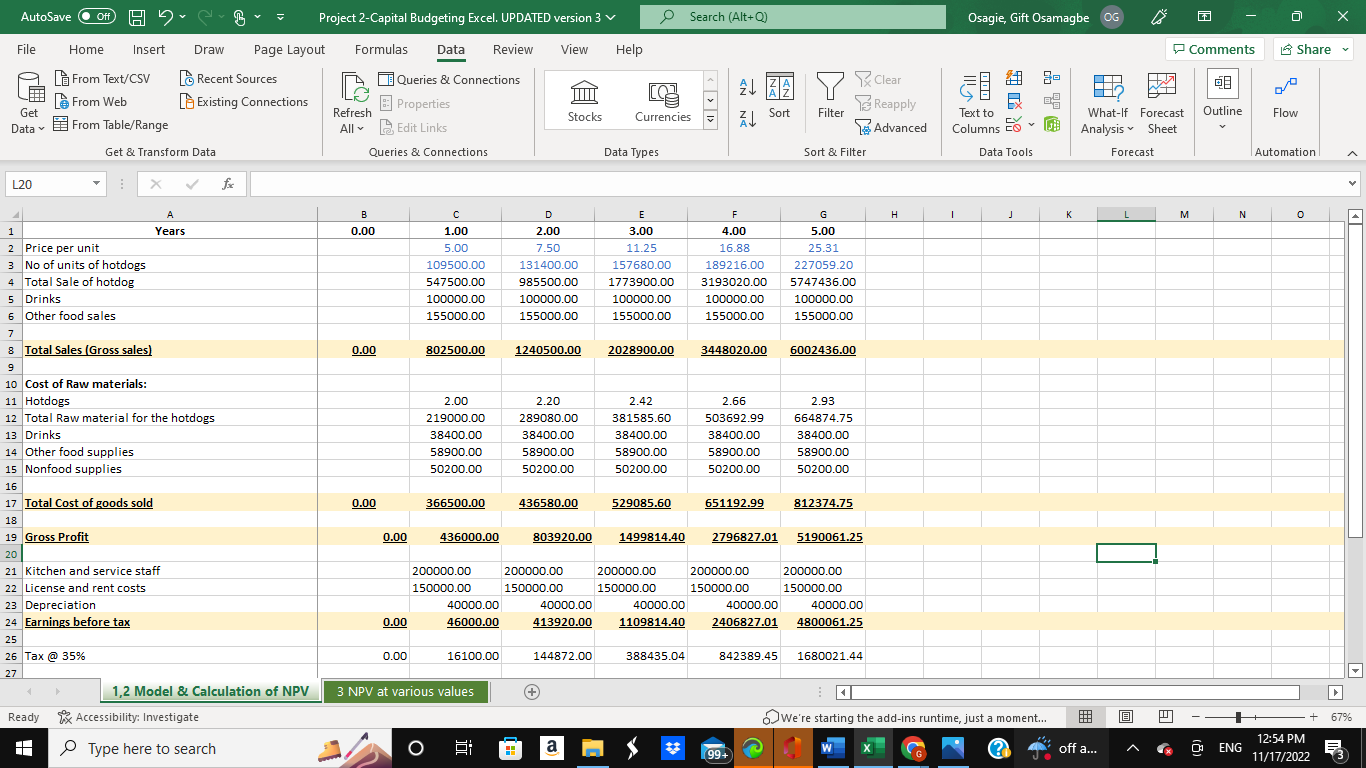
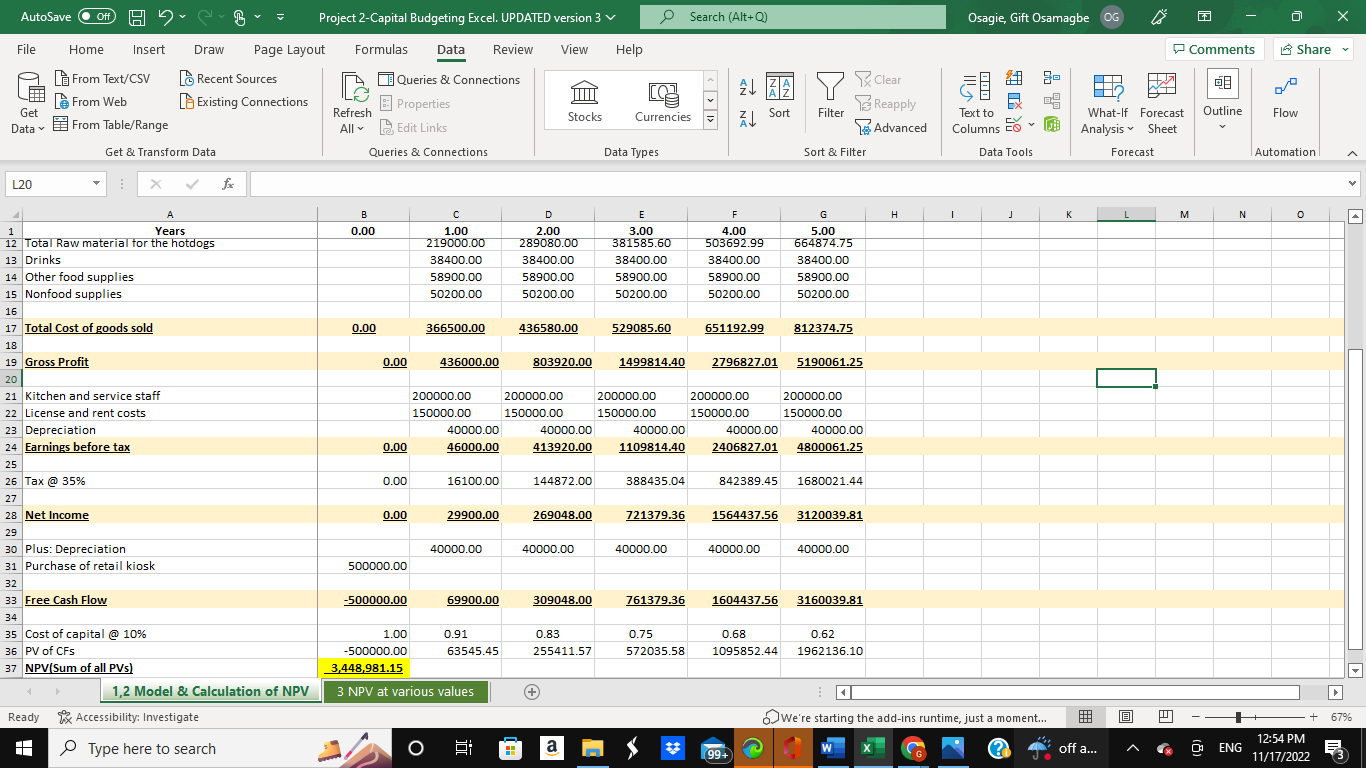
AutoSave Off File Get Data B3 11 12 13 14 15 16 17 18 Enter A Le From Web A 1 2 Rate 3 7.00% 4 8.00% 5 9.00% 6 10.00% 7 11.00% 8 12.00% 9 13.00% 10 $1.20 $1.00 $0.80 Home From Text/CSV $0.60 HC Insert From Table/Range Get & Transform Data X B NPV Draw Page Layout Recent Sources Existing Connections fxx C Project 2-Capital Budgeting Excel. UPDATED version 3 Formulas Data Review View Help 1,2 Model & Calculation of NPV Accessibility: Investigate Type here to search Queries & Connections Properties Edit Links Queries & Connections Refresh All D E NPV at Cost of Capital Tryout % Year 3 3 NPV at various values O 6: Stocks + a Currencies Data Types Search (Alt+Q) F Year 1 Year 2 Year 4 Year 5 $2,253,064.71 $ 65,327.10 $269,934.49 $ 621,512.36 $1,224,017.73 $ 64,722.22 $264,958.85 $ 604,407.48 $1,179,309.50 $2,150,670.00 $ 64,128.44 $260,119.52 $587,924.56 $1,136,624.01 $2,053,809.06 $ 63,545.45 $ 255,411.57 $572,035.58 $1,095,852.44 $1,962,136.10 $ 62,972.97 $ 250,830.29 $556,714.03 $1,056,892.71 $1,875,329.82 $ 62,410.71 $246,371.17 $541,934.79 $1,019,649.07 $1,793,091.45 $ 61,858.41 $242,029.92 $ 527,674.09 $ 984,031.60 $1,715,143.01 NPV and Cost of capital ALZA Sort IN N 99+ Filter Sort & Filter G Clear Reapply Advanced Osagie, Gift Osamagbe OG Text to Columns H R 8.2 Data Tools We're starting the add-ins runtime, just a moment... DA W HH2 MO What-If Forecast Analysis Sheet I off a... Forecast B " J F Comments DA Outline 0 ENG x Share Flow Automation K 12:54 PM 11/17/2022 V 100% AutoSave Off H File Home Insert From Text/CSV From Web Get Data From Table/Range L20 1 2 Price per unit 3 No of units of hotdogs 4 Total Sale of hotdog 5 Drinks 6 Other food sales Get & Transform Data 7 8 Total Sales (Gross sales) 9 10 Cost of Raw materials: X 23 Depreciation 24 Earnings before tax 25 26 Tax @ 35% 27 4 11 Hotdogs 12 Total Raw material for the hotdogs 13 Drinks 14 Other food supplies 15 Nonfood supplies 16 17 Total Cost of goods sold 18 19 Gross Profit 20 21 Kitchen and service staff 22 License and rent costs Ready AH A Years Draw Page Layout Recent Sources Existing Connections Accessibility: Investigate Project 2-Capital Budgeting Excel. UPDATED version 3 Formulas Data Review View Help Queries & Connections Properties Edit Links Queries & Connections fx Type here to search Refresh All B 0.00 1 0.00 0.00 0.00 S 0.00 0.00 1.00 5.00 109500.00 547500.00 100000.00 155000.00 802500.00 O 2.00 219000.00 38400.00 58900.00 50200.00 366500.00 1,2 Model & Calculation of NPV 3 NPV at various values 436000.00 200000.00 150000.00 40000.00 46000.00 16100.00 F: Im Stocks 1240500.00 D E 2.00 3.00 7.50 11.25 131400.00 157680.00 985500.00 1773900.00 100000.00 100000.00 155000.00 155000.00 2.20 289080.00 38400.00 58900.00 50200.00 436580.00 803920.00 200000.00 150000.00 40000.00 413920.00 144872.00 a Currencies Data Types 2028900.00 2.42 381585.60 38400.00 58900.00 50200.00 529085.60 1499814.40 200000.00 150000.00 40000.00 1109814.40 Search (Alt+Q) 388435.04 AJ ZA Sort EN N F 4.00 16.88 189216.00 3193020.00 100000.00 155000.00 2.66 503692.99 38400.00 58900.00 50200.00 651192.99 3448020.00 6002436.00 200000.00 150000.00 Filter 99+ Sort & Filter 842389.45 G 5.00 25.31 227059.20 5747436.00 100000.00 155000.00 2796827.01 5190061.25 2.93 664874.75 38400.00 58900.00 50200.00 812374.75 40000.00 40000.00 2406827.01 4800061.25 200000.00 150000.00 1680021.44 Clear Reapply Advanced H Osagie, Gift Osamagbe OG R 8. Text to Columns E Data Tools J We're starting the add-ins runtime, just a moment... K A off a... What-If Forecast Analysis Sheet WA Forecast L " M Comments O DA Outline N ENG Share Flow Automation 0 x 12:54 PM 11/17/2022 V + 67% AutoSave Off H File Home Insert From Text/CSV From Web Get Data From Table/Range L20 Get & Transform Data E X A 1 Years 12 Total Raw material for the hotdogs 13 Drinks 14 Other food supplies 15 Nonfood supplies 16 17 Total Cost of goods sold 18 19 Gross Profit 20 21 Kitchen and service staff 22 License and rent costs 23 Depreciation 24 Earnings before tax 25 26 Tax @ 35% 27 28 Net Income 29 30 Plus: Depreciation 31 Purchase of retail kiosk 32 33 Free Cash Flow Ready AH 34 35 Cost of capital @ 10% 36 PV of CFs 37 NPV(Sum of all PVs) Draw Page Layout Recent Sources Existing Connections fx 1,2 Model & Calculation of NPV Accessibility: Investigate Type here to search Project 2-Capital Budgeting Excel. UPDATED version 3 Formulas Data Review View Help Queries & Connections Properties Edit Links Queries & Connections Refresh All B 0.00 0.00 0.00 0.00 0.00 0.00 500000.00 -500000.00 1.00 1.00 219000.00 38400.00 58900.00 50200.00 366500.00 O 436000.00 200000.00 150000.00 40000.00 46000.00 16100.00 29900.00 40000.00 69900.00 0.91 63545.45 -500000.00 3,448,981.15 3 NPV at various values F: D 2.00 289080.00 38400.00 58900.00 50200.00 Stocks 436580.00 200000.00 150000.00 40000.00 413920.00 144872.00 269048.00 40000.00 309048.00 0.83 255411.57 a Currencies Data Types E 3.00 381585.60 38400.00 58900.00 50200.00 529085.60 803920.00 1499814.40 2796827.01 200000.00 150000.00 40000.00 1109814.40 388435.04 721379.36 40000.00 Search (Alt+Q) 761379.36 0.75 572035.58 AJ ZA EN N F 4.00 503692.99 38400.00 58900.00 50200.00 651192.99 200000.00 150000.00 Sort Filter 842389.45 1564437.56 40000.00 99+ 1604437.56 40000.00 40000.00 2406827.01 4800061.25 0.68 1095852.44 Sort & Filter G 5.00 664874.75 38400.00 58900.00 50200.00 812374.75 5190061.25 200000.00 150000.00 1680021.44 3120039.81 40000.00 3160039.81 0.62 1962136.10 Clear Reapply Advanced H Osagie, Gift Osamagbe OG R 8. Text to Columns E Data Tools J We're starting the add-ins runtime, just a moment... K A off a... What-If Forecast Analysis Sheet WA Forecast L B " M Comments O DA Outline N ENG Share Flow Automation 0 x 12:54 PM 11/17/2022 V + 67%
Step by Step Solution
There are 3 Steps involved in it

Get step-by-step solutions from verified subject matter experts