

Question: The ANOVA summary table for the Exercise 3 data is presented below. Refer to this information and to the Exercise 3 information to answer the
1. Is the picture color main effect statistically significant? If so, which color was associated with better memory test performance?
2. Is the cognitive style main effective statistically significant? If so, which cognitive style was associated with better memory test performance?
3. Is the interaction statistically significant? If so, which picture color is associated with better test performance for each of the two cognitive styles?
4. Calculate the proportion of variance explained by cognitive style.
5. Calculate the proportion of variance explained by the interaction.
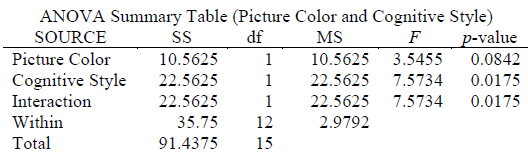
ANOVA Summary Table (Picture Color and Cognitive Style) p-value df SOURCE Picture Color Cognitive Style Interaction MS 10.5625 3.5455 22.5625 0.0842 0.0175 0.0175 10.5625 7.5734 22.5625 22.5625 7.5734 22.5625 35.75 Within Total 12 2.9792 91.4375 15
Step by Step Solution
3.48 Rating (174 Votes )
There are 3 Steps involved in it
1 The picture color main effect is not statistically s... View full answer

Get step-by-step solutions from verified subject matter experts