

Question: AutoSave ( Off ) H Activity 9 - Chi-Squared Test robsjr8@gmail.com R X File Home Insert Draw Design Layout References Mailings Review View Help Search
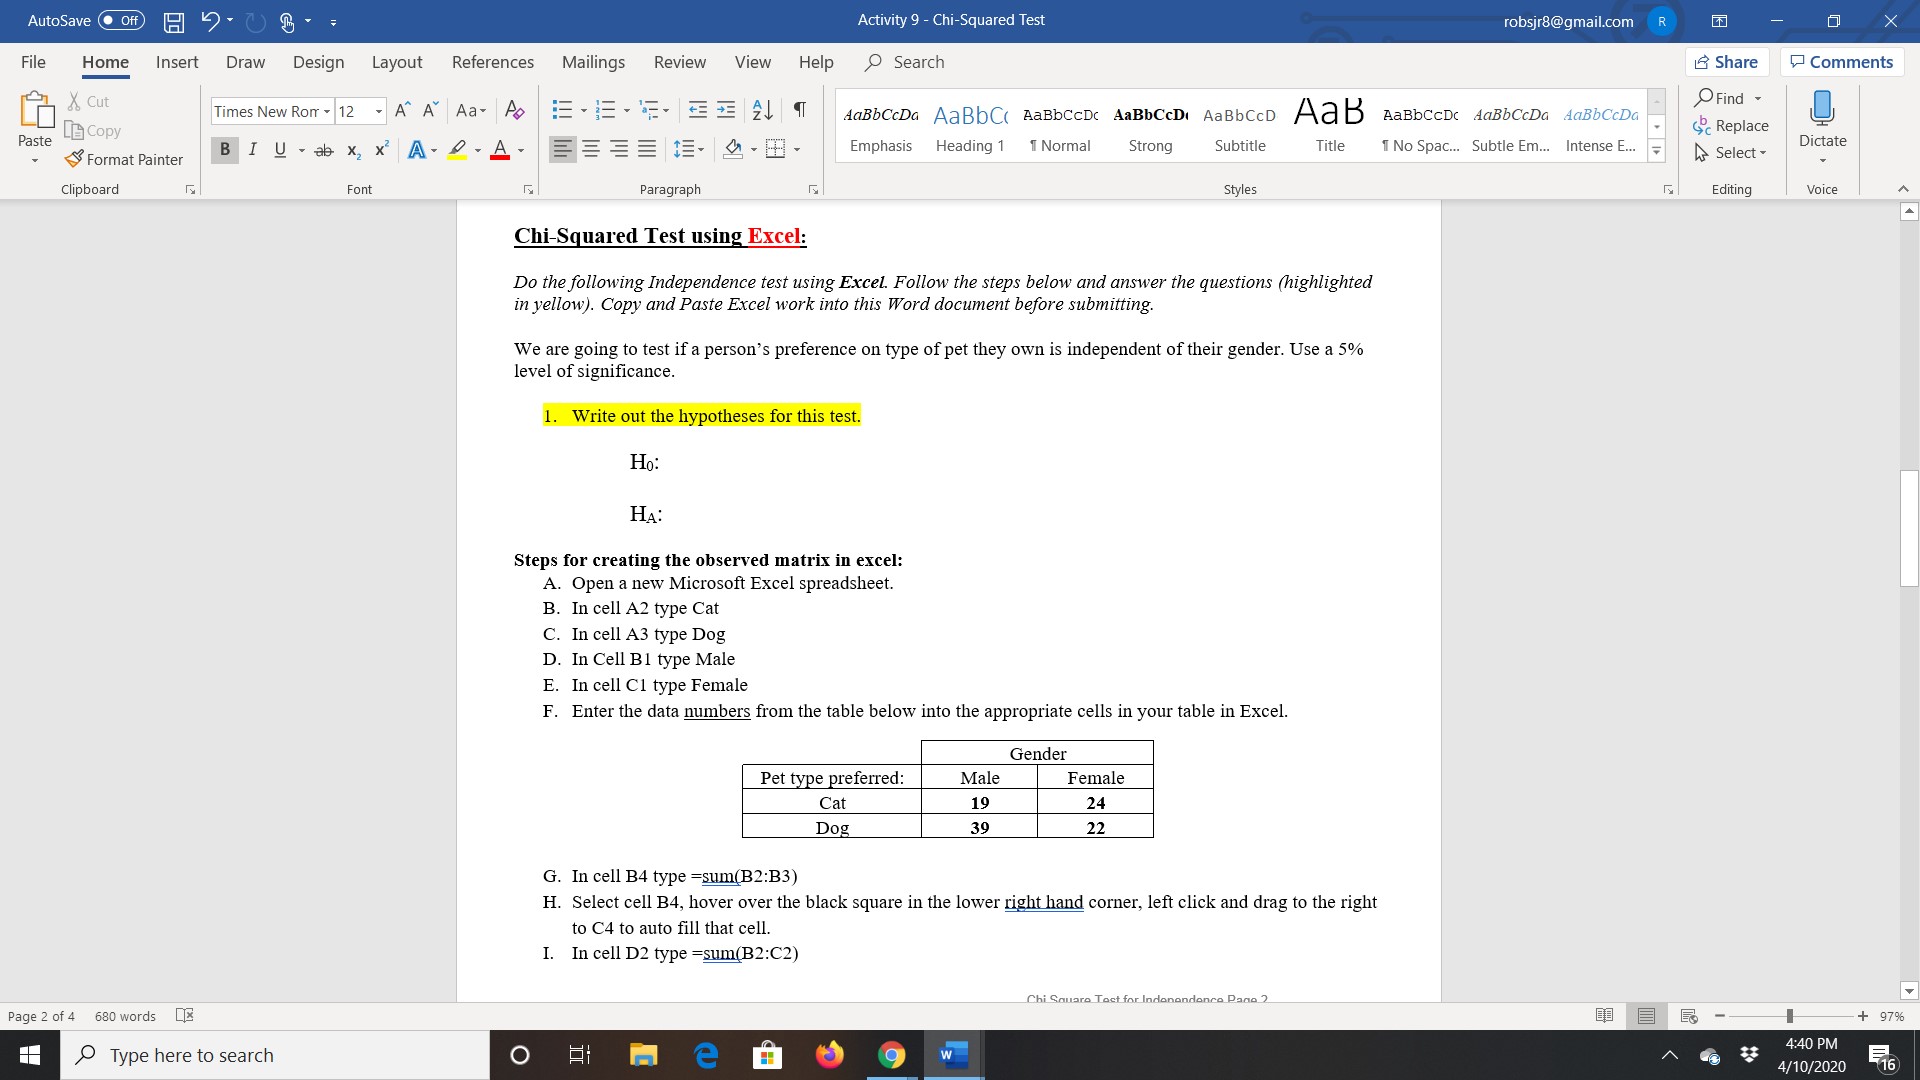
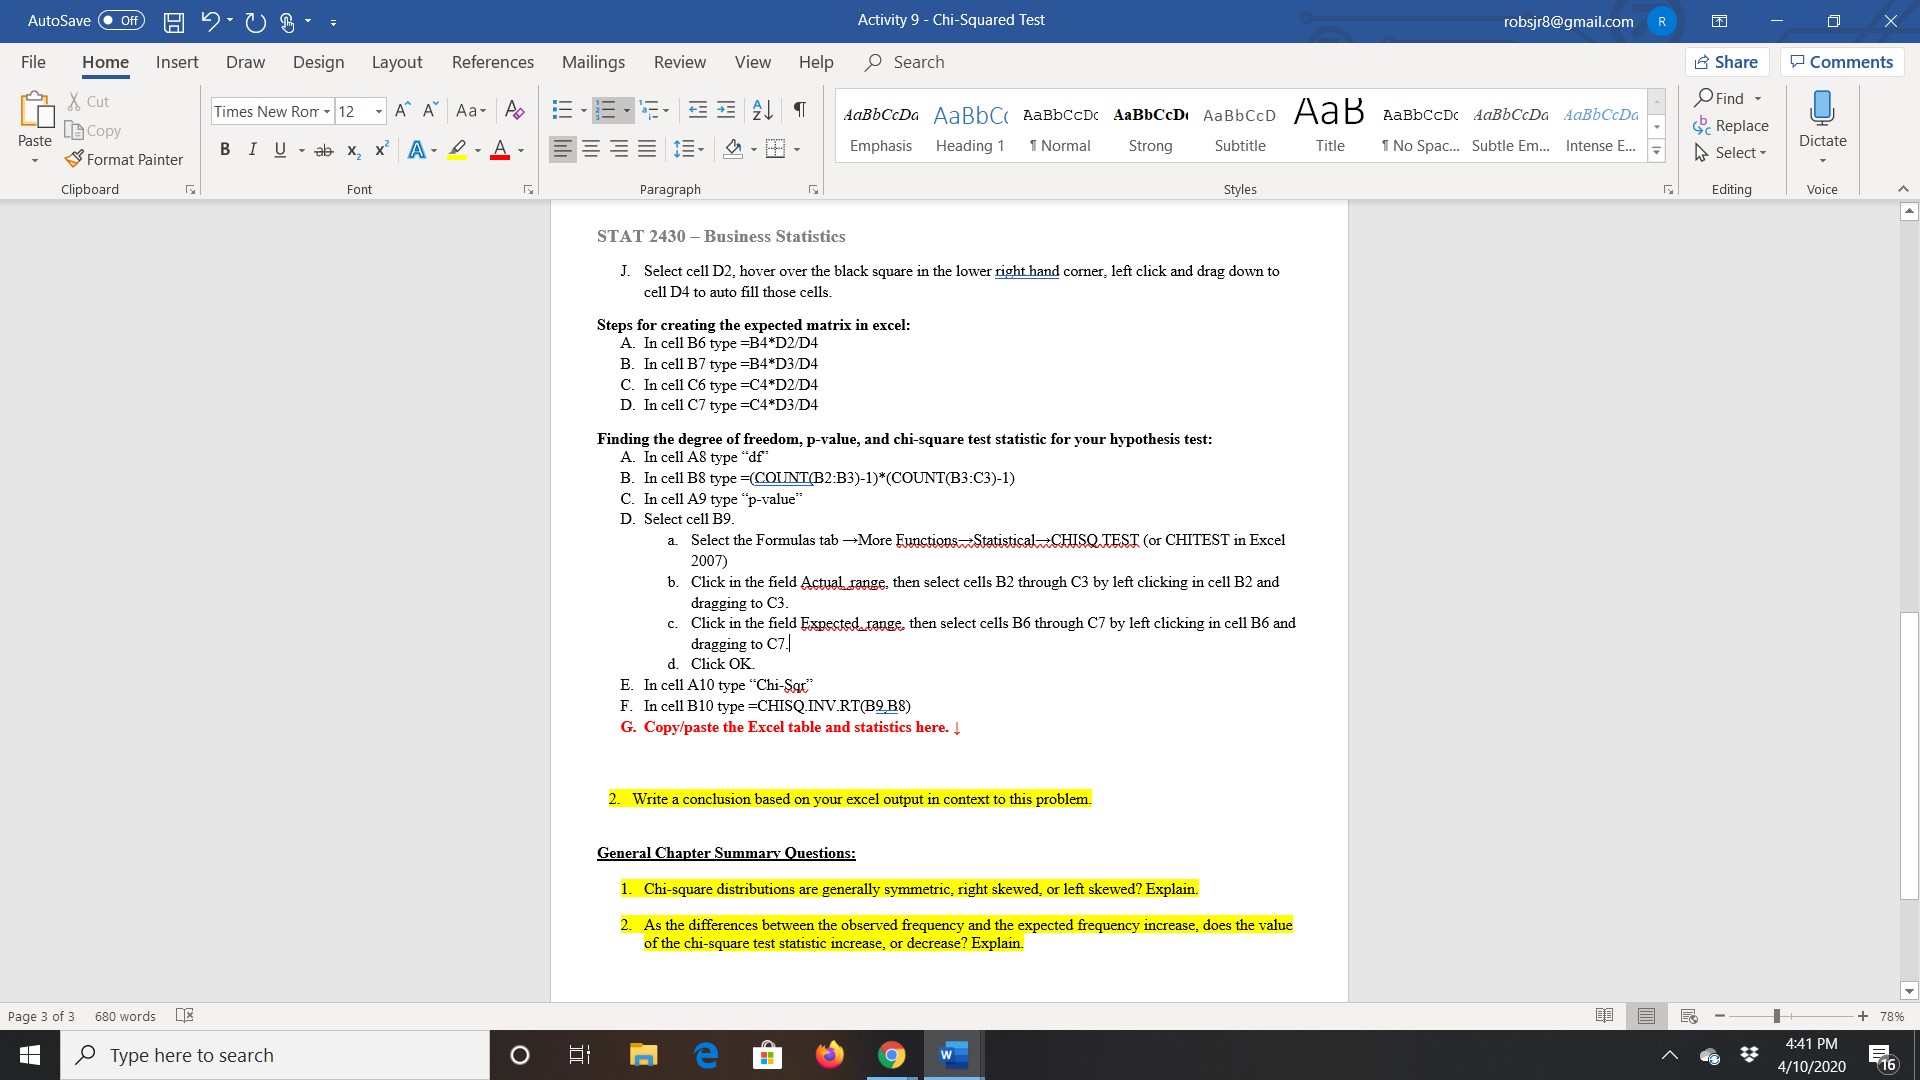
AutoSave ( Off ) H Activity 9 - Chi-Squared Test robsjr8@gmail.com R X File Home Insert Draw Design Layout References Mailings Review View Help Search Share Comments X Cut Times New Rom - 12 - A" A Aa- A E . = . F . E 21 9 AaBbCcDa AaBbC( AaBbCCDc AaBbCcD( AaBbCCD AaB AaBbCCDC AaBbCcDa AaBbCcDa Find - Paste Copy Replace Format Painter BIU - ab x x A 2 . A . BBB. 3 . BB- Emphasis Heading 1 1 Normal Strong Subtitle Title 1 No Spac... Subtle Em... Intense E... F Select - Dictate Clipboard Font Paragraph Styles Editing Voice Chi-Squared Test using Excel: Do the following Independence test using Excel. Follow the steps below and answer the questions (highlighted in yellow). Copy and Paste Excel work into this Word document before submitting. We are going to test if a person's preference on type of pet they own is independent of their gender. Use a 5% level of significance. 1. Write out the hypotheses for this test. Ho: HA: Steps for creating the observed matrix in excel: A. Open a new Microsoft Excel spreadsheet. B. In cell A2 type Cat C. In cell A3 type Dog D. In Cell Bl type Male E. In cell C1 type Female F. Enter the data numbers from the table below into the appropriate cells in your table in Excel. Gender Pet type preferred: Male Female Cat 19 24 Dog 39 22 G. In cell B4 type =sum(B2:B3) H. Select cell B4, hover over the black square in the lower right hand corner, left click and drag to the right to C4 to auto fill that cell. I. In cell D2 type =sum(B2:C2) Chi Square Test for Indonandonce Page 2 Page 2 of 4 680 words X - + 97% Type here to search me 9 w 4:40 PM 4/10/2020 16AutoSave ( Off ) H Activity 9 - Chi-Squared Test robsjr8@gmail.com R X File Home Insert Draw Design Layout References Mailings Review View Help Search Share Comments X Cut Times New Rom - 12 - A" A Aa- A AaBbCcDa AaBbC( AaBbCCDc AaBbCcD( AaBbCCD AaB AaBbCCDC AaBbCcDa AaBbCcDa Find - Copy Replace Paste BI U - ab x x A 2 . A . = = = 1. 3 . BB. Emphasis Heading 1 1 Normal Strong Subtitle Title Format Painter 1 No Spac... Subtle Em... Intense E... F Select - Dictate Clipboard Font Paragraph Styles Editing Voice STAT 2430 - Business Statistics J. Select cell D2, hover over the black square in the lower right hand corner, left click and drag down to cell D4 to auto fill those cells Steps for creating the expected matrix in excel: A. In cell B6 type =B4*D2/D4 B. In cell B7 type =B4*D3/D4 C. In cell C6 type =C4*D2/D4 D. In cell C7 type =C4*D3/D4 Finding the degree of freedom, p-value, and chi-square test statistic for your hypothesis test: A. In cell A8 type "df" B. In cell B8 type =(COUNT(B2:B3)-1)*(COUNT(B3:C3)-1) C. In cell A9 type "p-value" D. Select cell B9. a. Select the Formulas tab -More Functions Statistical-CHISQ TEST (or CHITEST in Excel 2007) b. Click in the field Actual range, then select cells B2 through C3 by left clicking in cell B2 and dragging to C3. c. Click in the field Expected range. then select cells B6 through C7 by left clicking in cell B6 and dragging to C7. d. Click OK. E. In cell A10 type "Chi-Squ" F. In cell B10 type =CHISQ.INV.RT(B2 B8) G. Copy/paste the Excel table and statistics here. I 2. Write a conclusion based on your excel output in context to this problem. General Chapter Summary Questions: 1. Chi-square distributions are generally symmetric, right skewed, or left skewed? Explain. 2. As the differences between the observed frequency and the expected frequency increase, does the value of the chi-square test statistic increase, or decrease? Explain. Page 3 of 3 680 words - 78% Type here to search O EI me 9 w 1:41 PM 4/10/2020 16
Step by Step Solution
There are 3 Steps involved in it

Get step-by-step solutions from verified subject matter experts