

Question: The question that I need help with is highlighted in screenshot 40. If the data is calculated in a regression analysis table with the X
The question that I need help with is highlighted in screenshot 40. If the data is calculated in a regression analysis table with the X values in screenshot 37 would a correlation be involved between engine specifications and gas mileage? Thank you for your time.
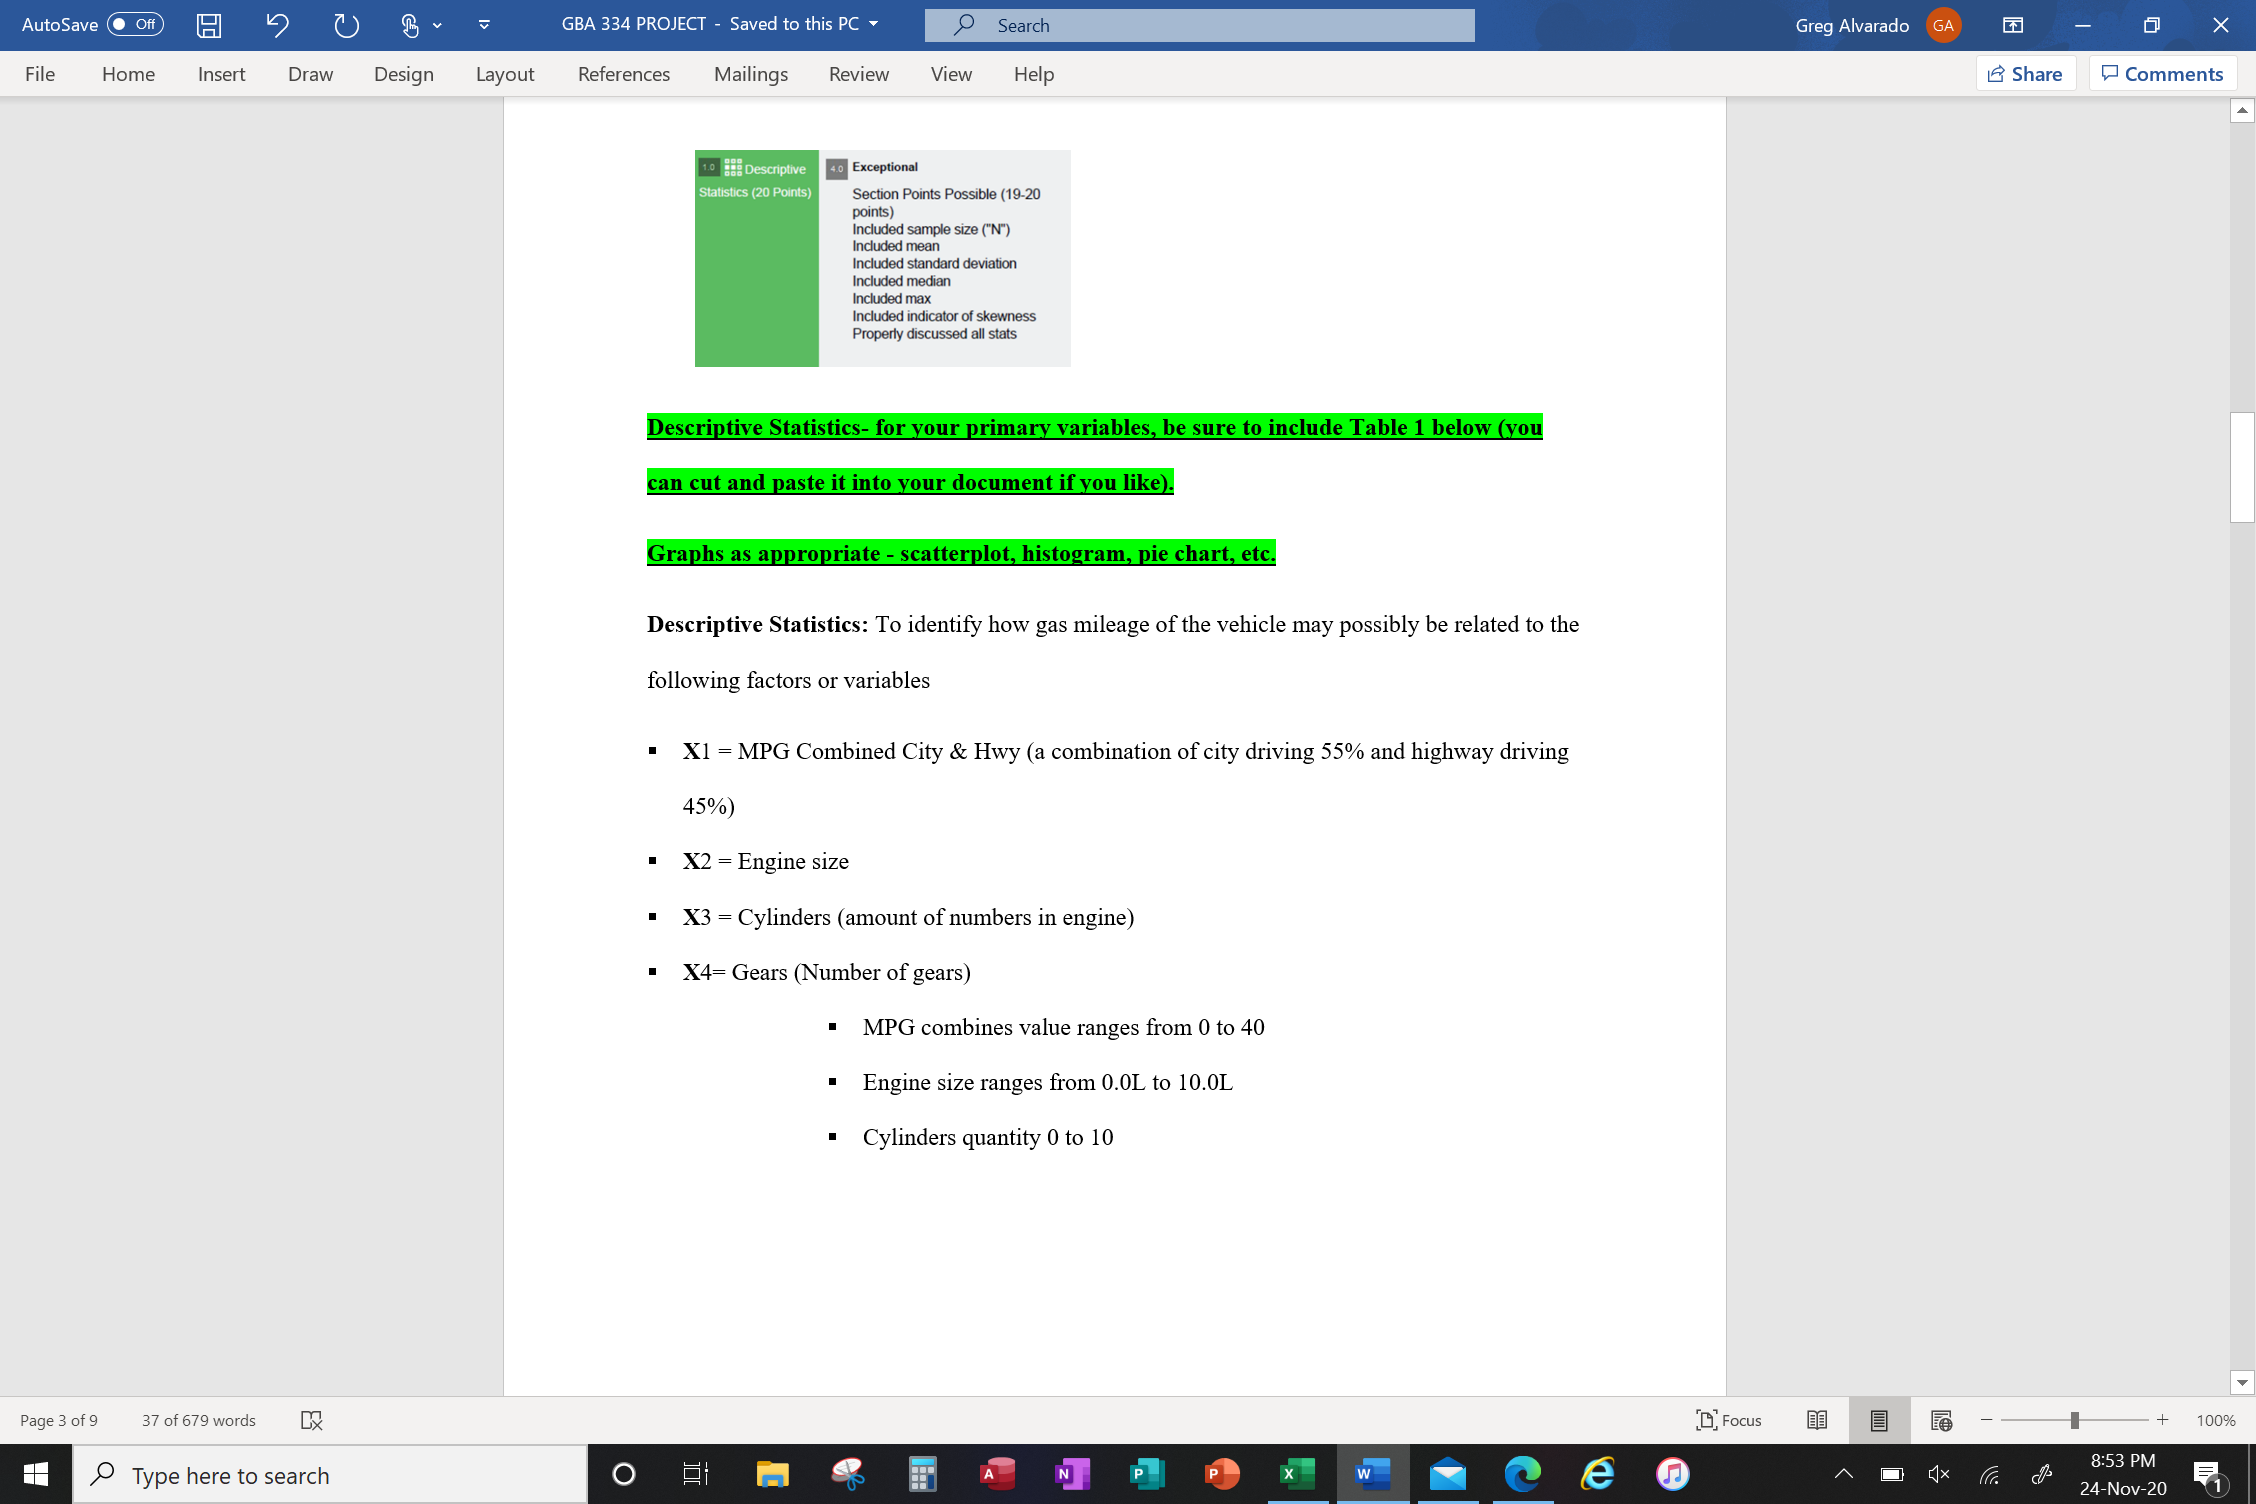
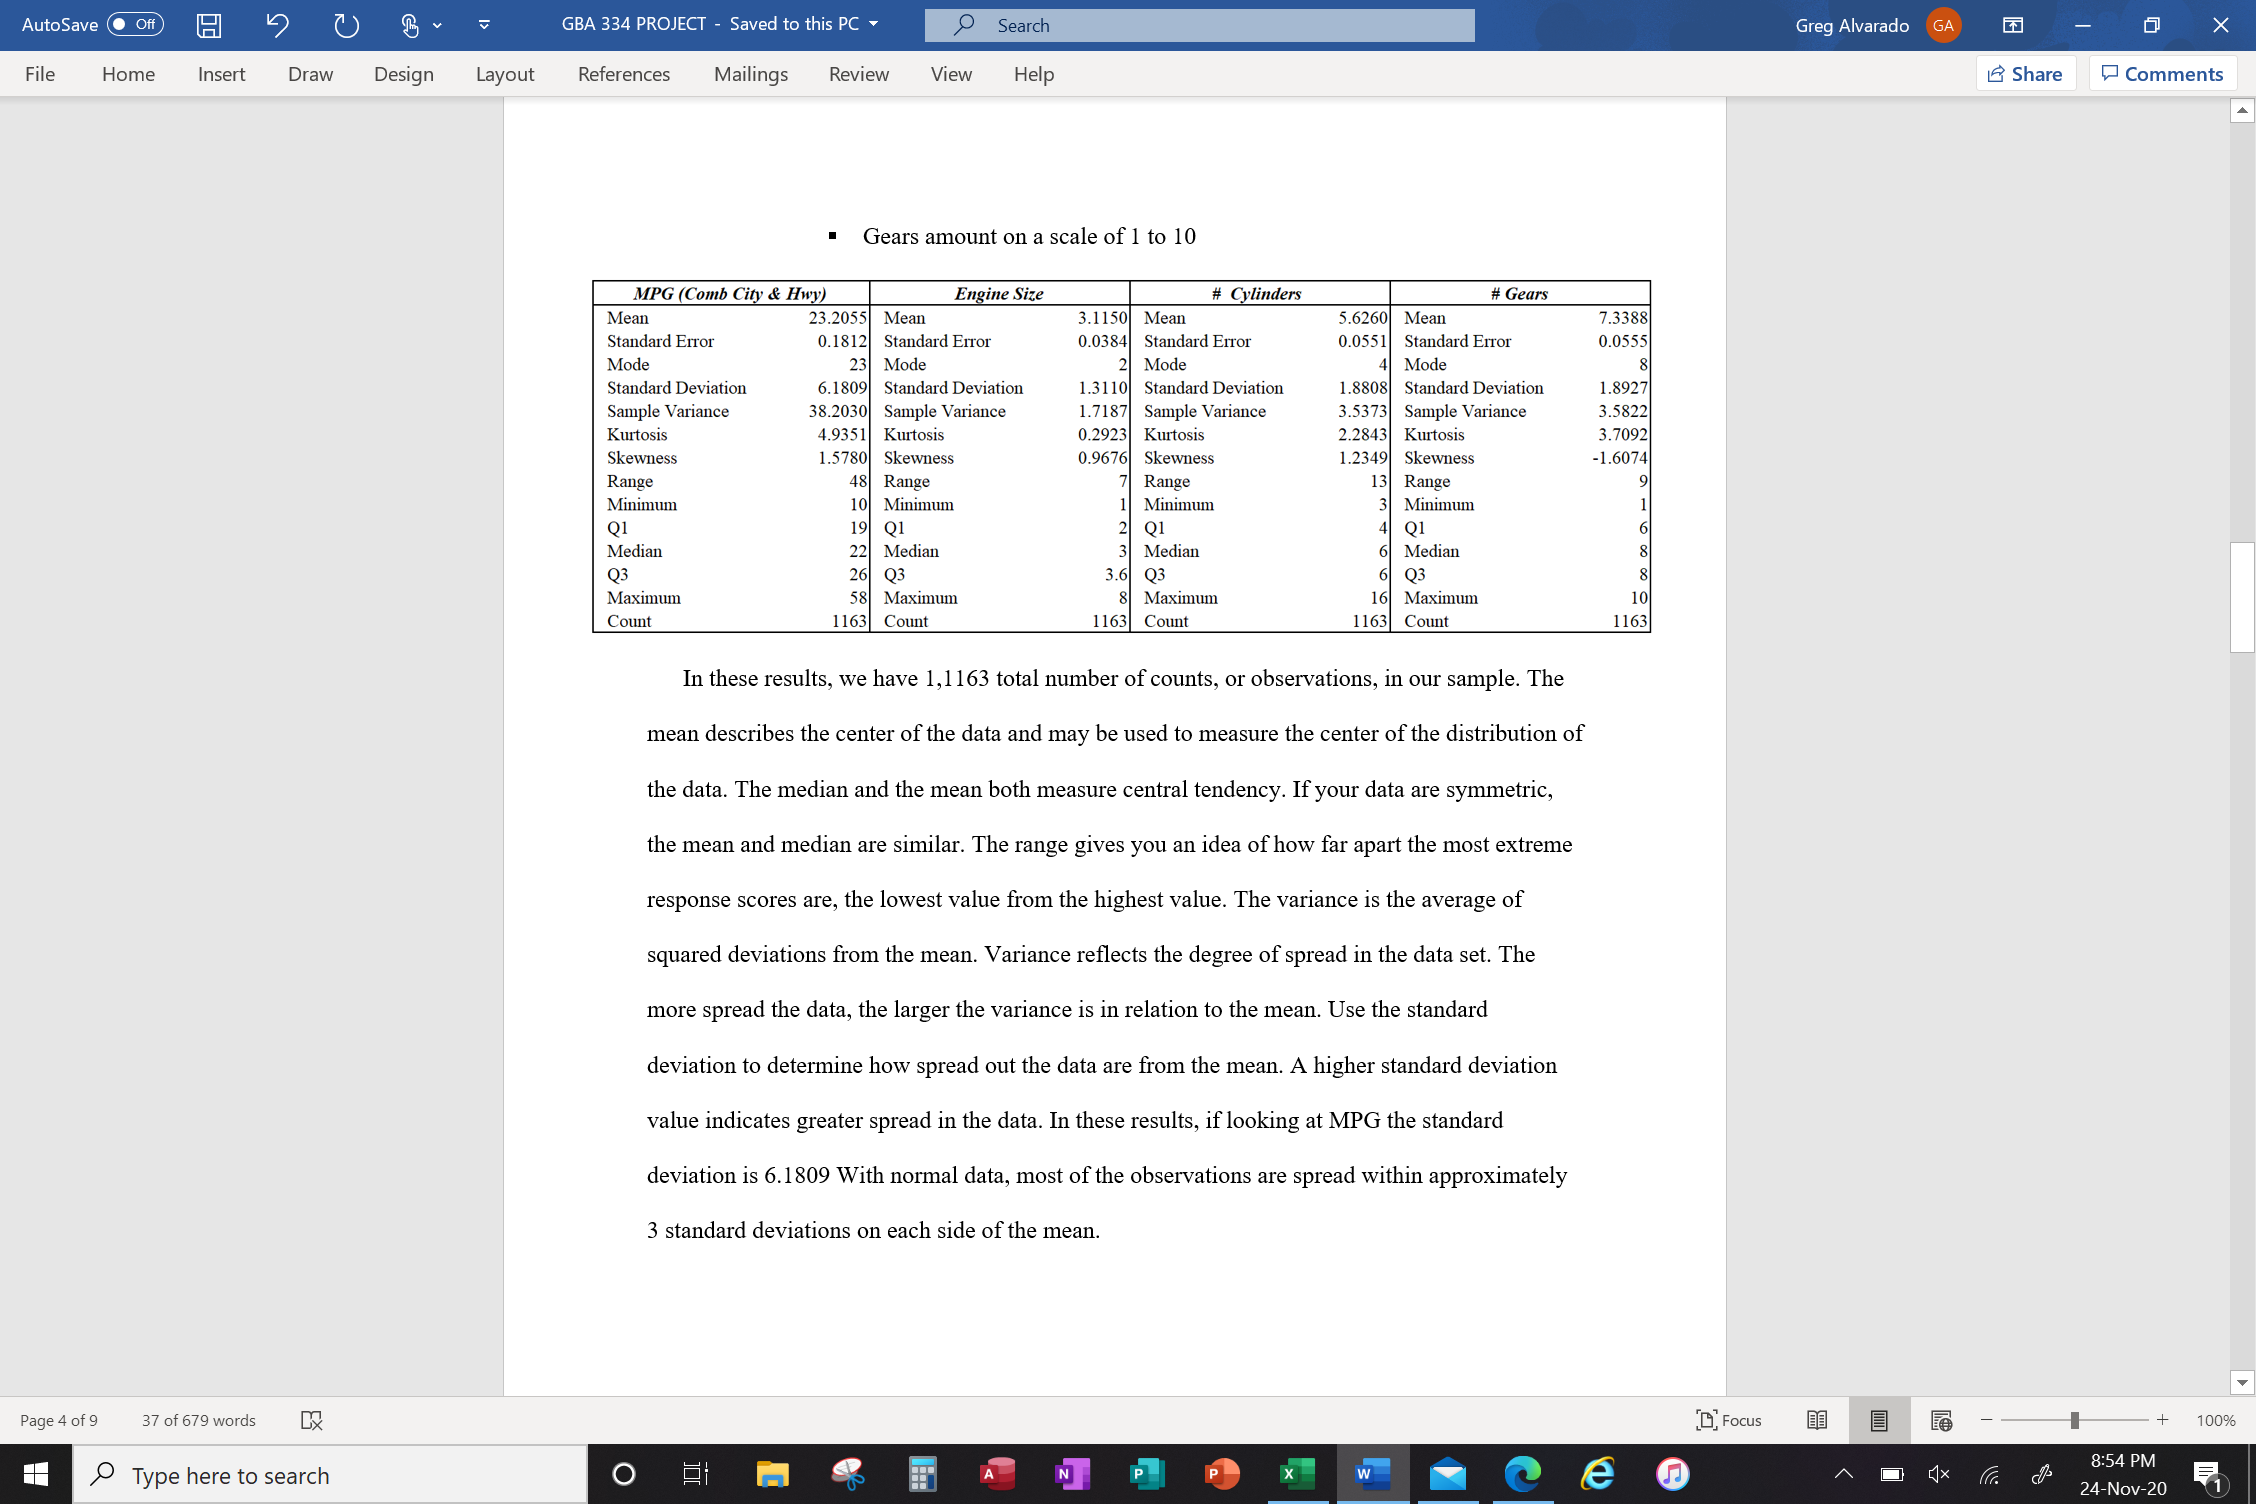
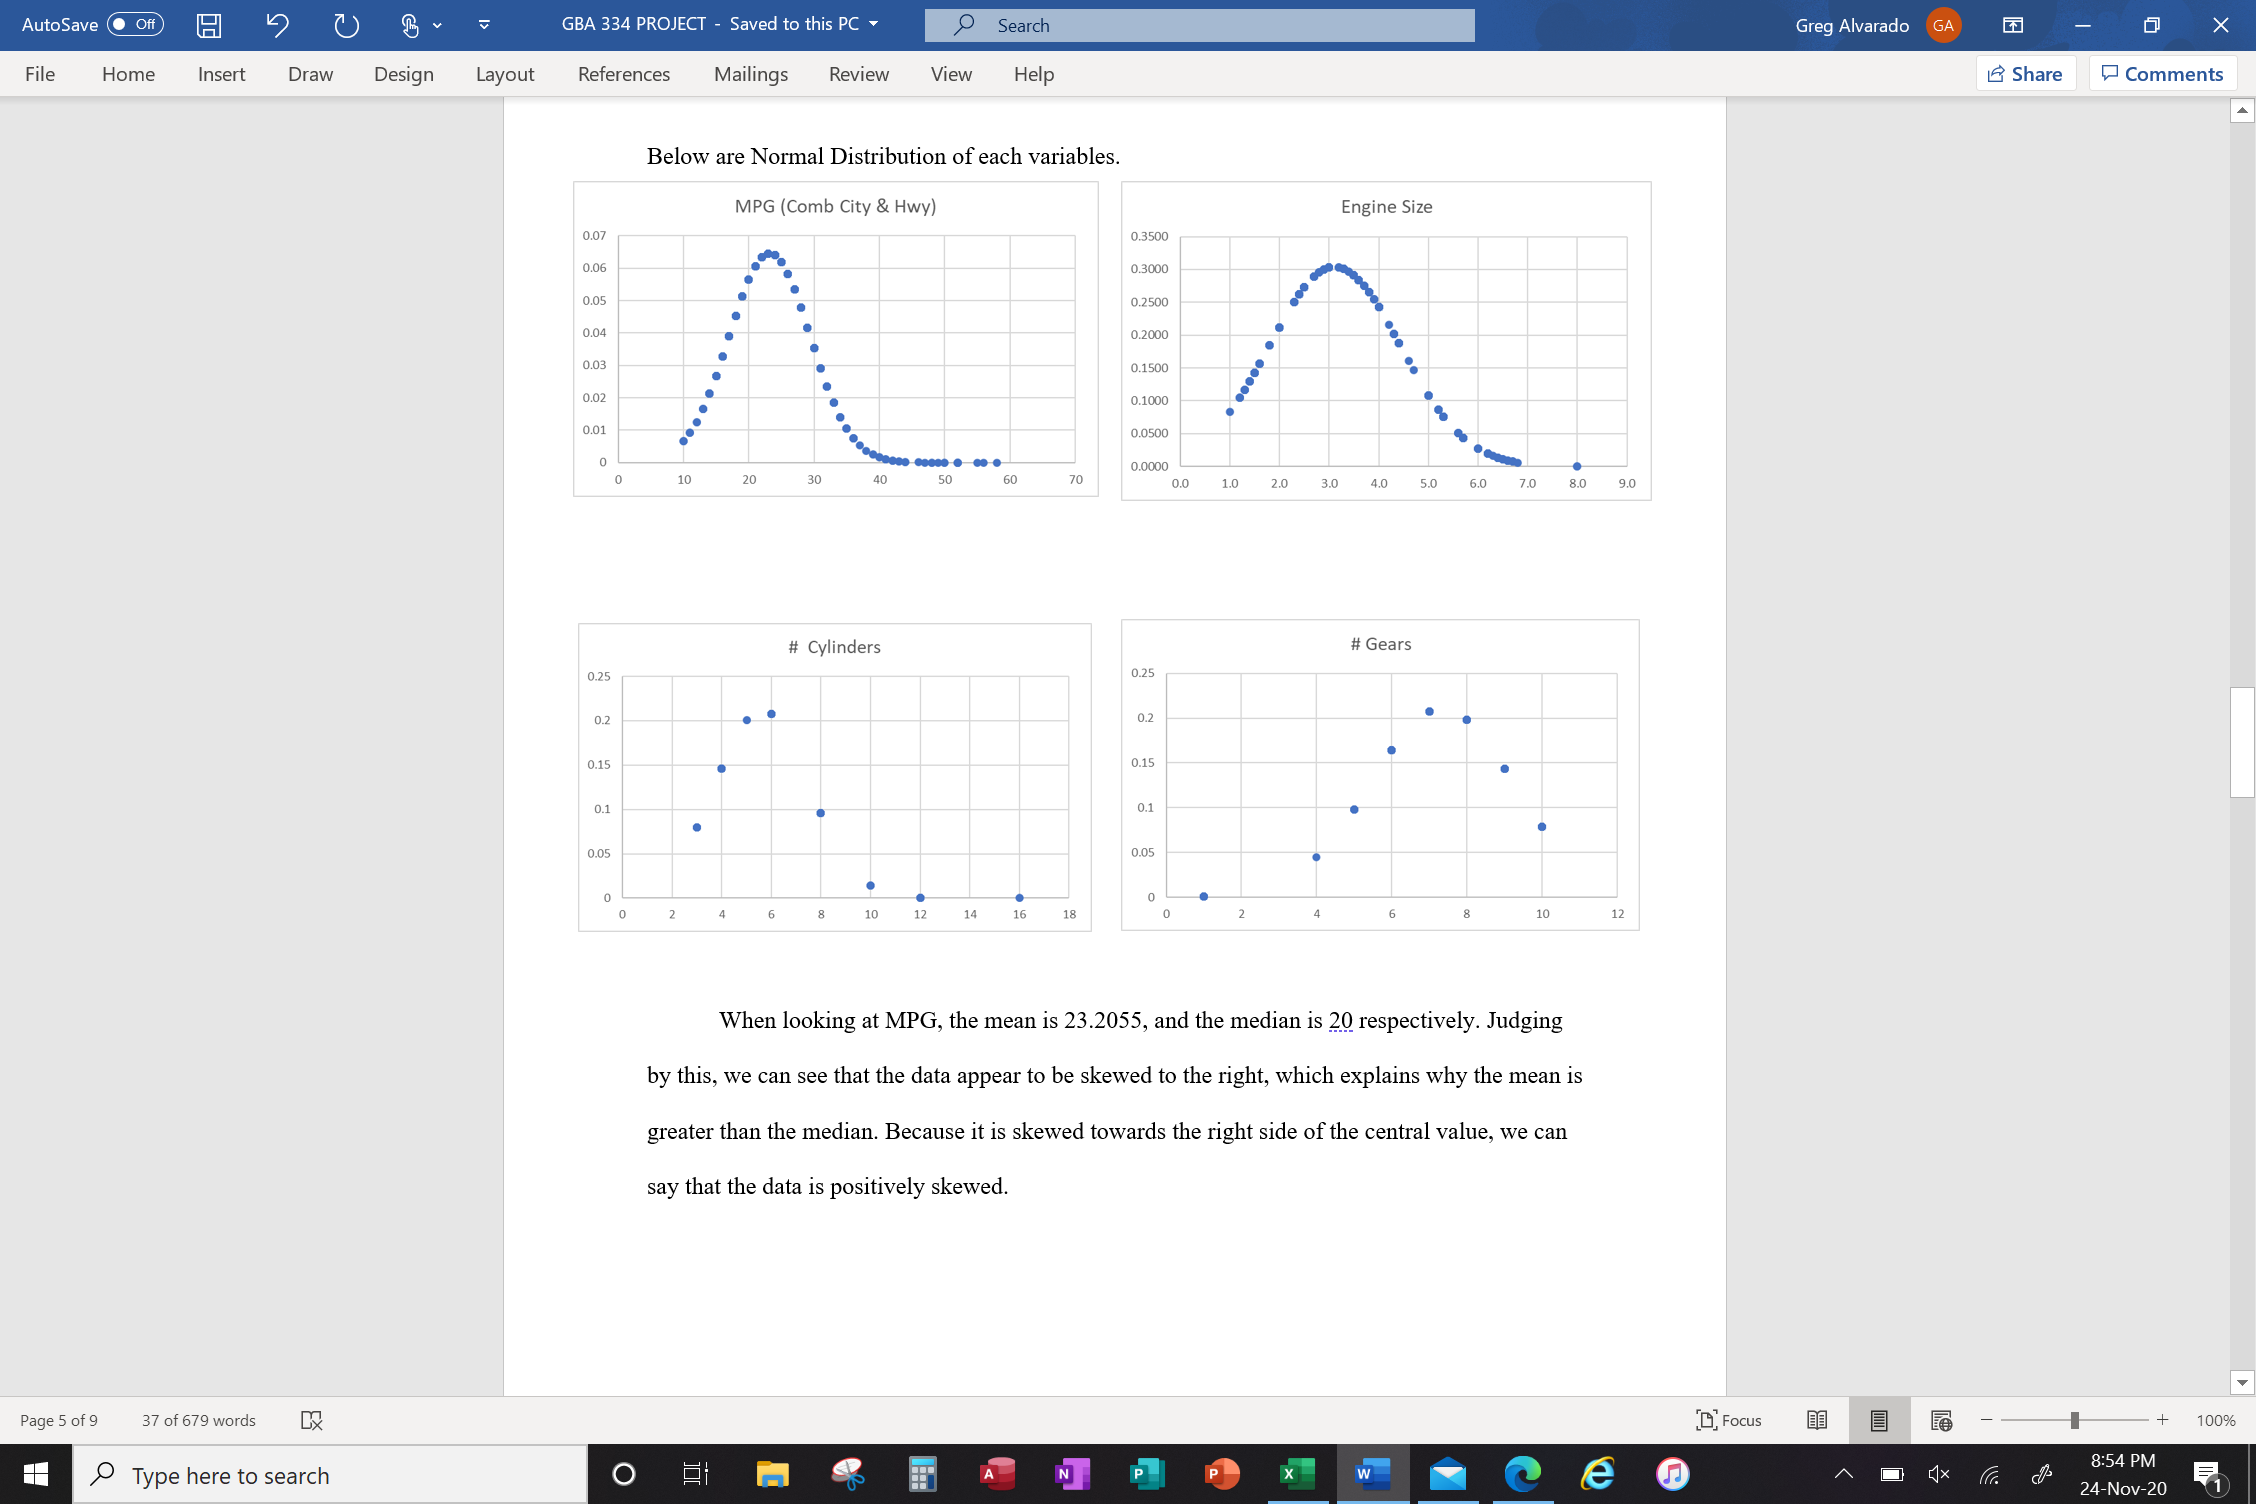
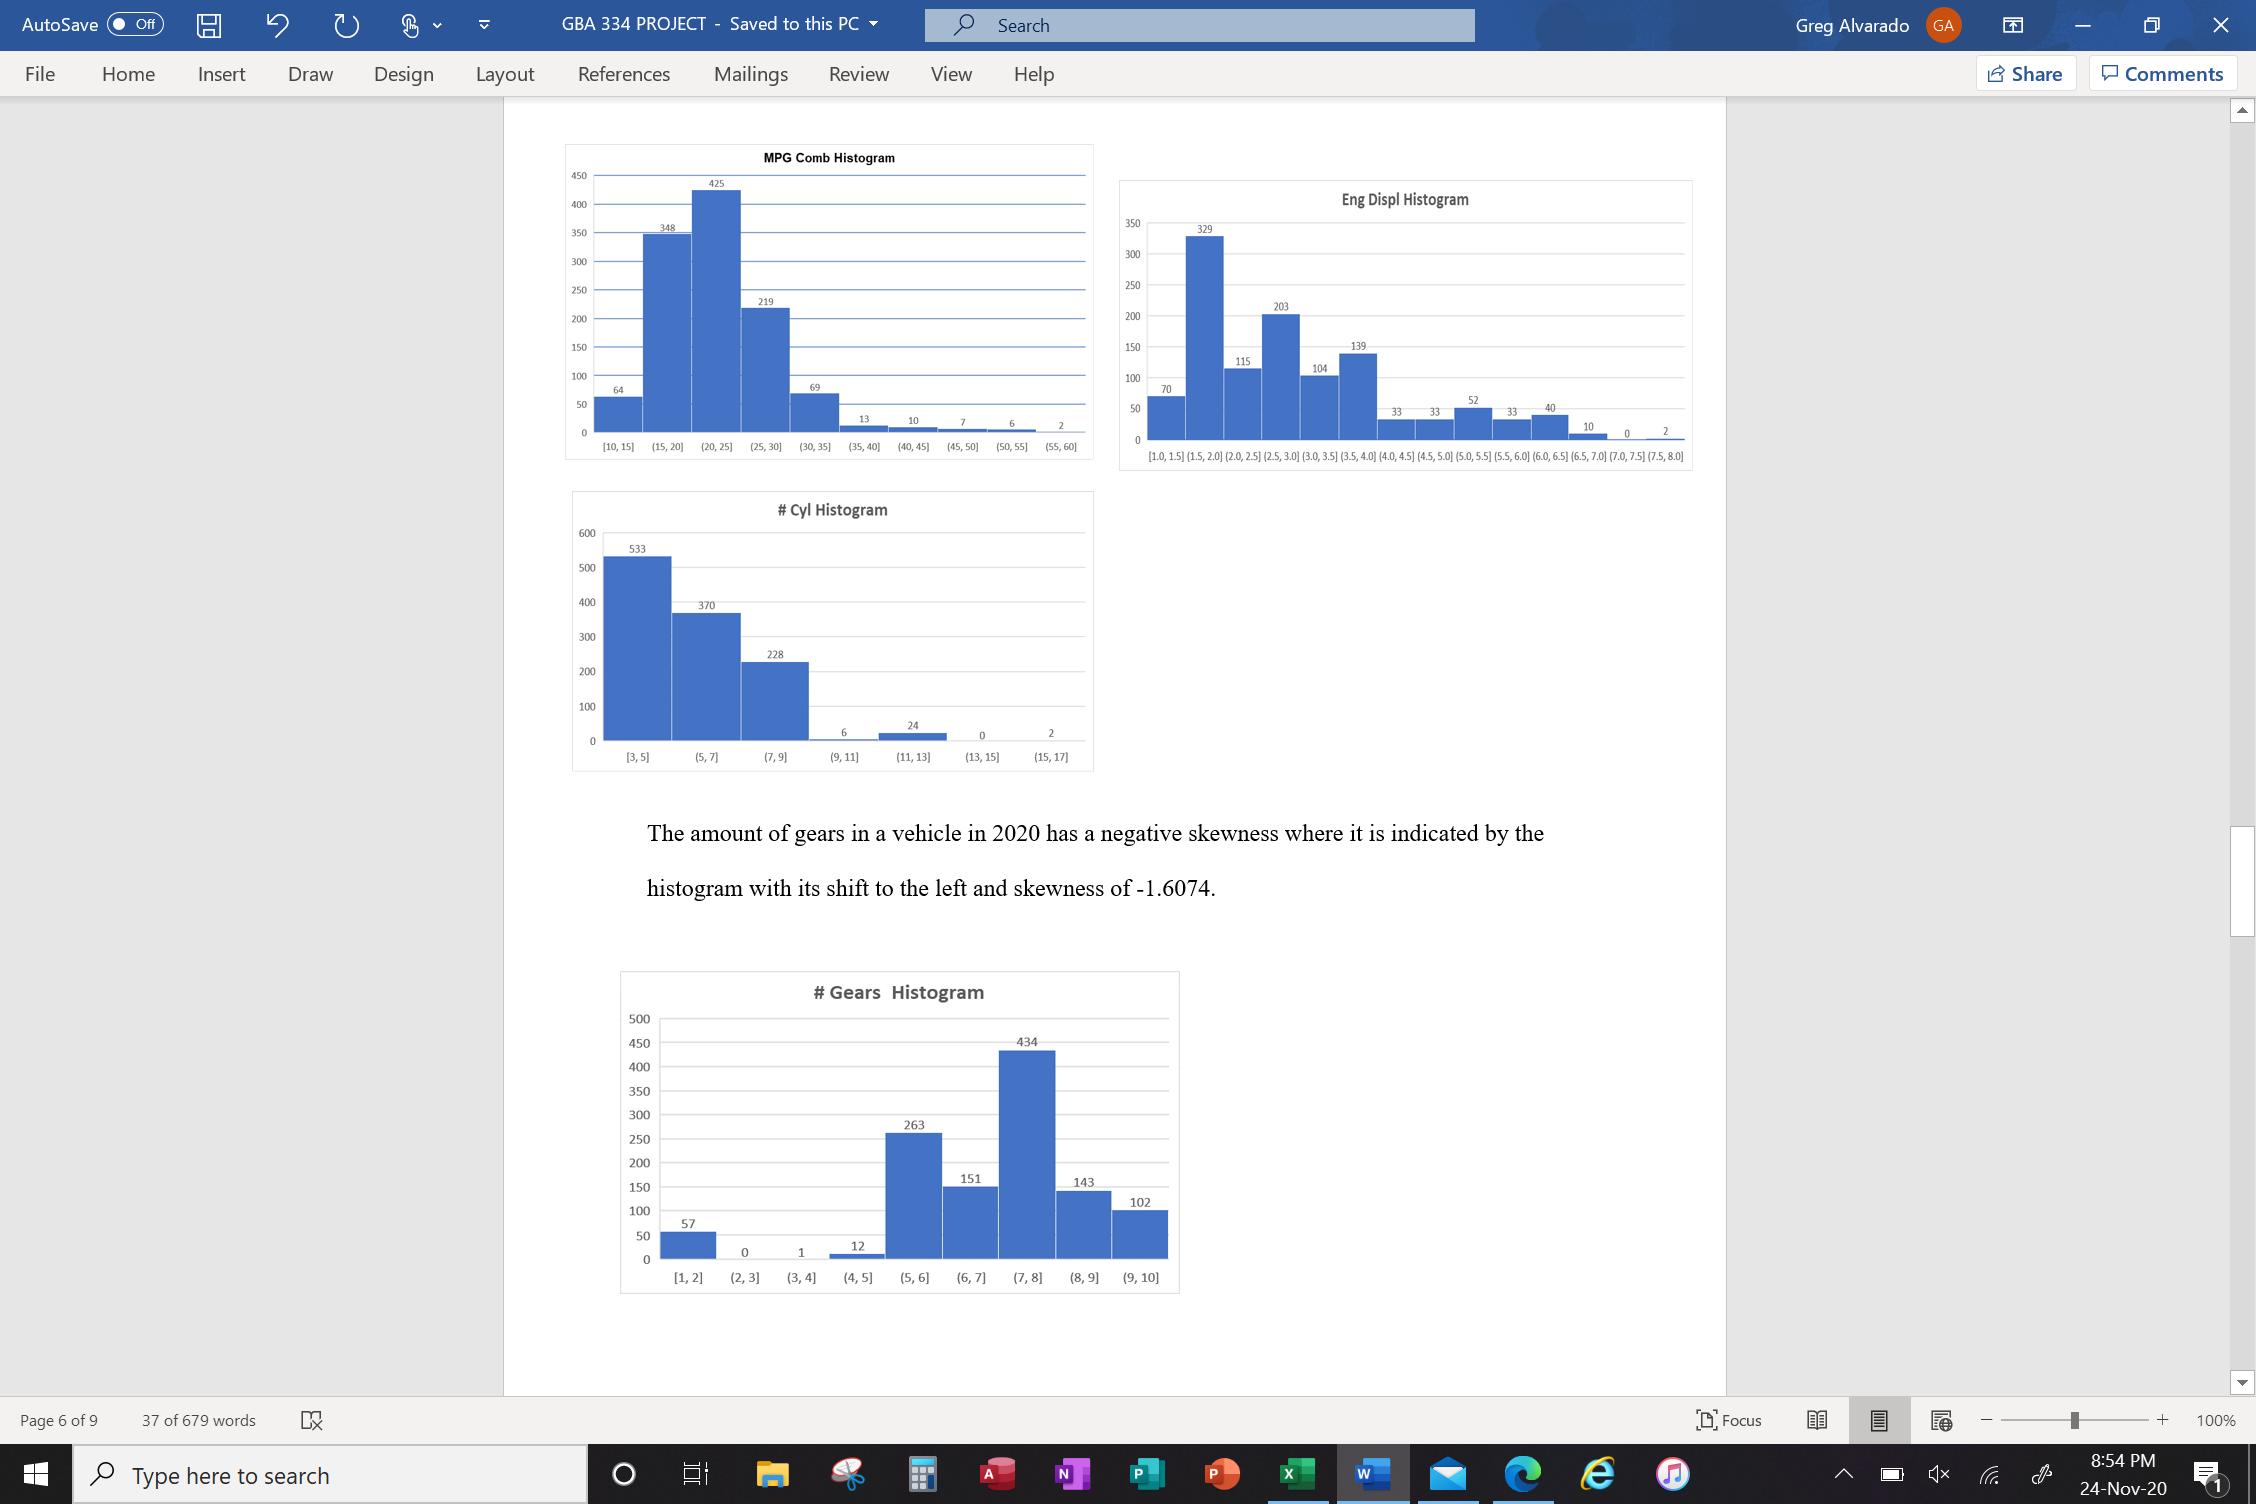
Greg Alvarado File Home Insert Draw Design Layout References Mailings Review View Help 6 Share 5' Comments i ' [Tl How does gas mileage depend on the number of cylinders, engine si:e and gears of the vehicles manufactured in 2020? This project evaluates and identies how gas mileage of a vehicle may possibly be related to variables such as Miles per Gallon (combining city and hm, engine size, number of cylinders and gears This topic was chosen to best understand how all the Variables mentioned above can help us best identify what a person should consider most when purchasing a car if he or she is concerned with getting the best gas mileage In today's economy many people are trying to save where they can and to do what is best for their nances Through the completion of this project we can demonstrate the importance and the effects these variables have on gas mileage. Furthermore, it gives the tools and knowledge to become morally responsible when selecting a vehicle The data used in this project was collected from the US. Department of energy's fuel economy data for the year of 2020. ***** Asaigmnent parameters\"*" Final Report: As mentioned earlier, this project can be a written report, a PowerPoint or Prezi presentation, or a combination of the three. Regardless of the form the presentation takes, it must include the following areas: 0 Introduction What was your project? Why did you choose the topic? What was the main research question? How did completing this project demonstrate Saint Leo University's core value of excellence? I Data What was your data source? What dates did it cover'? What was the web site you obtained it from? What variables did you include? Identify all dependent and independent variables. What were their values and what do those values signify/2 0 Descriptive Statisu'cs for your primary variables, be sure to include Table 1 below (you can cut and paste it into your document it you like). Graphs as appropriate scatterplot, histogram, pie chart, etc. Testing Conducted what type of test did you conduct? What were the results? Conclusion - Wrap up your report in a concise mannerr Clearly state what you Ieamed from the results and any potential shortcomings of your analysis. Page 2 of9 37 or 679 words IE 31qu; l! E _ 4'7 + 100% n p Type here to search AutoSave . Off H GBA 334 PROJECT - Saved to this PC 9 Search Greg Alvarado GA X File Home Insert Draw Design Layout References Mailings Review View Help 15 Share Comments 1.0 Descriptive .0 Exceptional Statistics (20 Points) Section Points Possible (19-20 points) Included sample size ("N") Included mean Included standard deviation Included median Included indicator of skewness Properly discussed all stats Descriptive Statistics- for your primary variables, be sure to include Table 1 below (you can cut and paste it into your document if you like). Graphs as appropriate - scatterplot, histogram, pie chart, etc. Descriptive Statistics: To identify how gas mileage of the vehicle may possibly be related to the following factors or variables X1 = MPG Combined City & Hwy (a combination of city driving 55% and highway driving 45%) X2 = Engine size . X3 = Cylinders (amount of numbers in engine) X4= Gears (Number of gears) MPG combines value ranges from 0 to 40 " Engine size ranges from 0.OL to 10.0L Cylinders quantity 0 to 10 Page 3 of 9 37 of 679 words Focus + 100% O A N P X 8:53 PM Type here to search W 24-Nov-20GBA 334 PROJECT - Saved to this PC 9 Search Greg Alvarado GA X AutoSave . Off H 15 Share Comments File Home Insert Draw Design Layout References Mailings Review View Help Gears amount on a scale of 1 to 10 MPG (Comb City & Hwy) Engine Size # Cylinders # Gears 23.2055 Mean 3.1150 Mean 5.6260 Mean 7.3388 Mean Standard Error 0.1812 Standard Error 0.0384 Standard Error 0.0551 Standard Error 0.0555 Mode 23 Mode 2 Mode 4 Mode Standard Deviation 6.1809 Standard Deviation 1.3110 Standard Deviation 1.8808 Standard Deviation 1.8927 Sample Variance 38.2030 Sample Variance 1.7187 Sample Variance 3.5373 Sample Variance 3.5822 4.9351 Kurtosis 3.7092 Kurtosis 0.2923 Kurtosis 2.2843 Kurtosis Skewness 1.5780 Skewness 0.9676 Skewness 1.2349 Skewness 1.6074 Range 48 Range 7 Range 13 Range Minimum 10 Minimum 1 Minimum 3 Minimum Q1 19 Q1 2 Q1 Median 22 Median 3 Median 6 Median 5 00 00 Q3 26 Q3 3.6 Q3 6 Q Maximum 58 Maximum 8 Maximum 16 Maximum Count 1163 Count 1163 Count 1163 Count 163 In these results, we have 1, 1163 total number of counts, or observations, in our sample. The mean describes the center of the data and may be used to measure the center of the distribution of the data. The median and the mean both measure central tendency. If your data are symmetric, the mean and median are similar. The range gives you an idea of how far apart the most extreme response scores are, the lowest value from the highest value. The variance is the average of squared deviations from the mean. Variance reflects the degree of spread in the data set. The more spread the data, the larger the variance is in relation to the mean. Use the standard deviation to determine how spread out the data are from the mean. A higher standard deviation value indicates greater spread in the data. In these results, if looking at MPG the standard deviation is 6.1809 With normal data, most of the observations are spread within approximately 3 standard deviations on each side of the mean. [ Focus + 100% Page 4 of 9 37 of 679 words 8:54 PM Type here to search O A N P P X w 24-Nov-20AutoSave File Home Insert Draw Page 5 069 37 of 679 words IE} Design Layout GBA 33 PRO CT Saved to thls PL V References 007 use has um um; 002 am 0.25 D) 015 m cos n p Type here to search Mailings Review View Help Below are Normal Distribution of each variables MPG (Comb City & Hwy) 70 a: Cylinders When looking at MPG, the mean is 23.2055, and the median is _ 03500 a 3000 0250:) 0 mm mm o 1000 o 9500 Damn uzs oz 0.15 01 nos 00 Engine Size 10 2,0 3,0 40 so an 70 so 9,0 :1 Gears _ respectively Judging by this, we can see that the data appear to be skewed to the right, which explains why the mean is greater than the median. Because it is skewed towards the right side of the central value, we can say that the data is positively skewed. Alvarado \\5 Share 5' Comments GBA 334 PROJECT - Saved to this PC X AutoSave . Off H 9 Search Greg Alvarado GA File Home Insert Draw Design Layout References Mailings Review View Help 15 Share Comments MPG Comb Histogram Eng Displistogram 350 219 200 150 139 100 100 104 52 33 [10, 15] (15, 20] (20, 25] (25, 30] (30, 35] (35, 40] (40, 45] (45, 50] (50, 55] (55, 60] [1.0, 1.5] (1.5, 2.0] (2.0, 2.5] (2.5, 3.0] (3.0, 3.5] (3.5, 4.0] (4.0, 4.5] (4.5, 5.0] (5.0, 5.5] (5.5, 6.0] (6.0, 6.5] (6.5, 7.0] (7.0, 7.5) (7.5, 8.0] # Cyl Histogram 600 533 500 400 370 300 228 200 100 0 [3, 5) (5, 7] (7,9] (9, 11] (11, 13] (13, 15] (15, 17] The amount of gears in a vehicle in 2020 has a negative skewness where it is indicated by the histogram with its shift to the left and skewness of -1.6074. # Gears Histogram 500 450 434 400 350 300 263 250 200 151 143 150 102 100 57 50 0 1 12 [1, 2] (2, 3] (3, 4) (4, 5] (5, 6] (6, 7] (7, 8] (8, 9] (9, 10] Focus + 100% Page 6 of 9 37 of 679 words 8:54 PM Type here to search O A N P X W 24-Nov-20GBA 334 PROJECT , Saved to thls PL V ' eg Alvalado A E File Home Insert Draw Design Layout References Mailings Review View Help \\5 Share 53 Comments ' W Aer review of the information how would one describe the testing conducted and the conclusion of said test Information analysis is to be done in a regression style table showing correlation between engine specications and gas milage. Page 9 of 9 679 words [)2 In: Focus n p Type here to search
Step by Step Solution
There are 3 Steps involved in it

Get step-by-step solutions from verified subject matter experts