

Question: AutoSave OFF ... Home Insert Draw Page Layout >> Tell me h?. Tables Data from Illustrations Add-ins Recommended Picture Charts A1 X V fx Distance


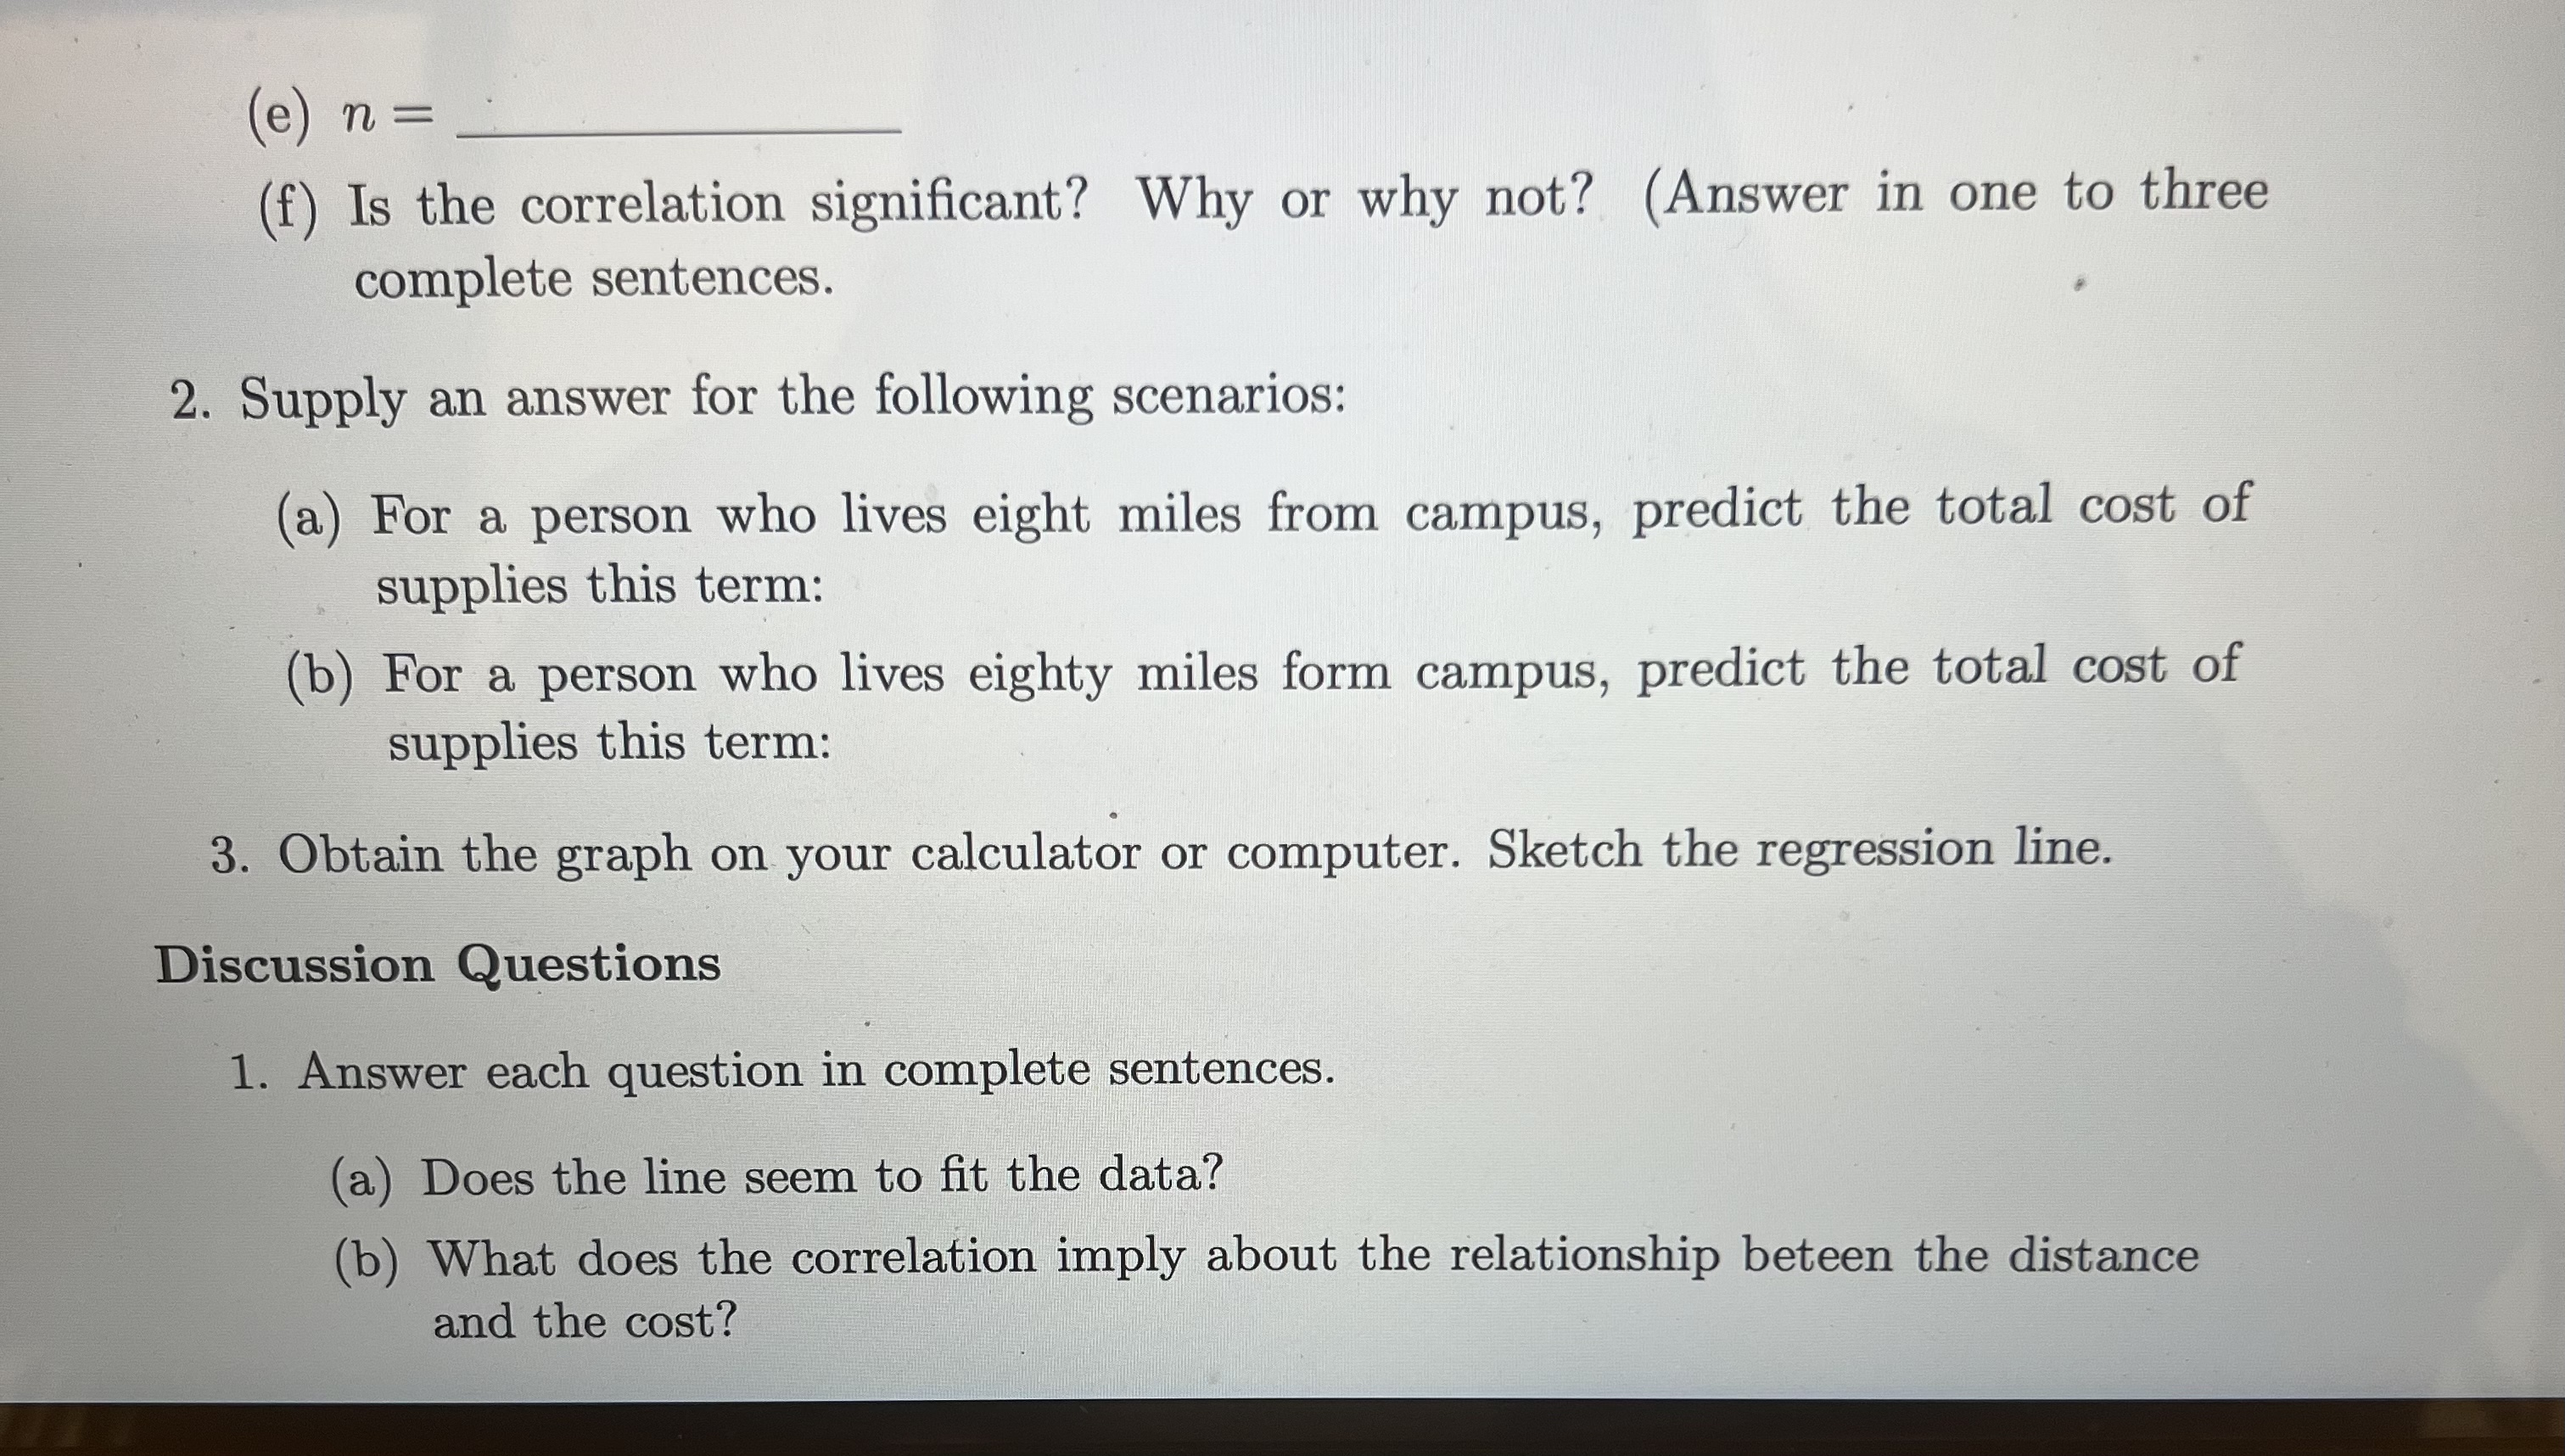
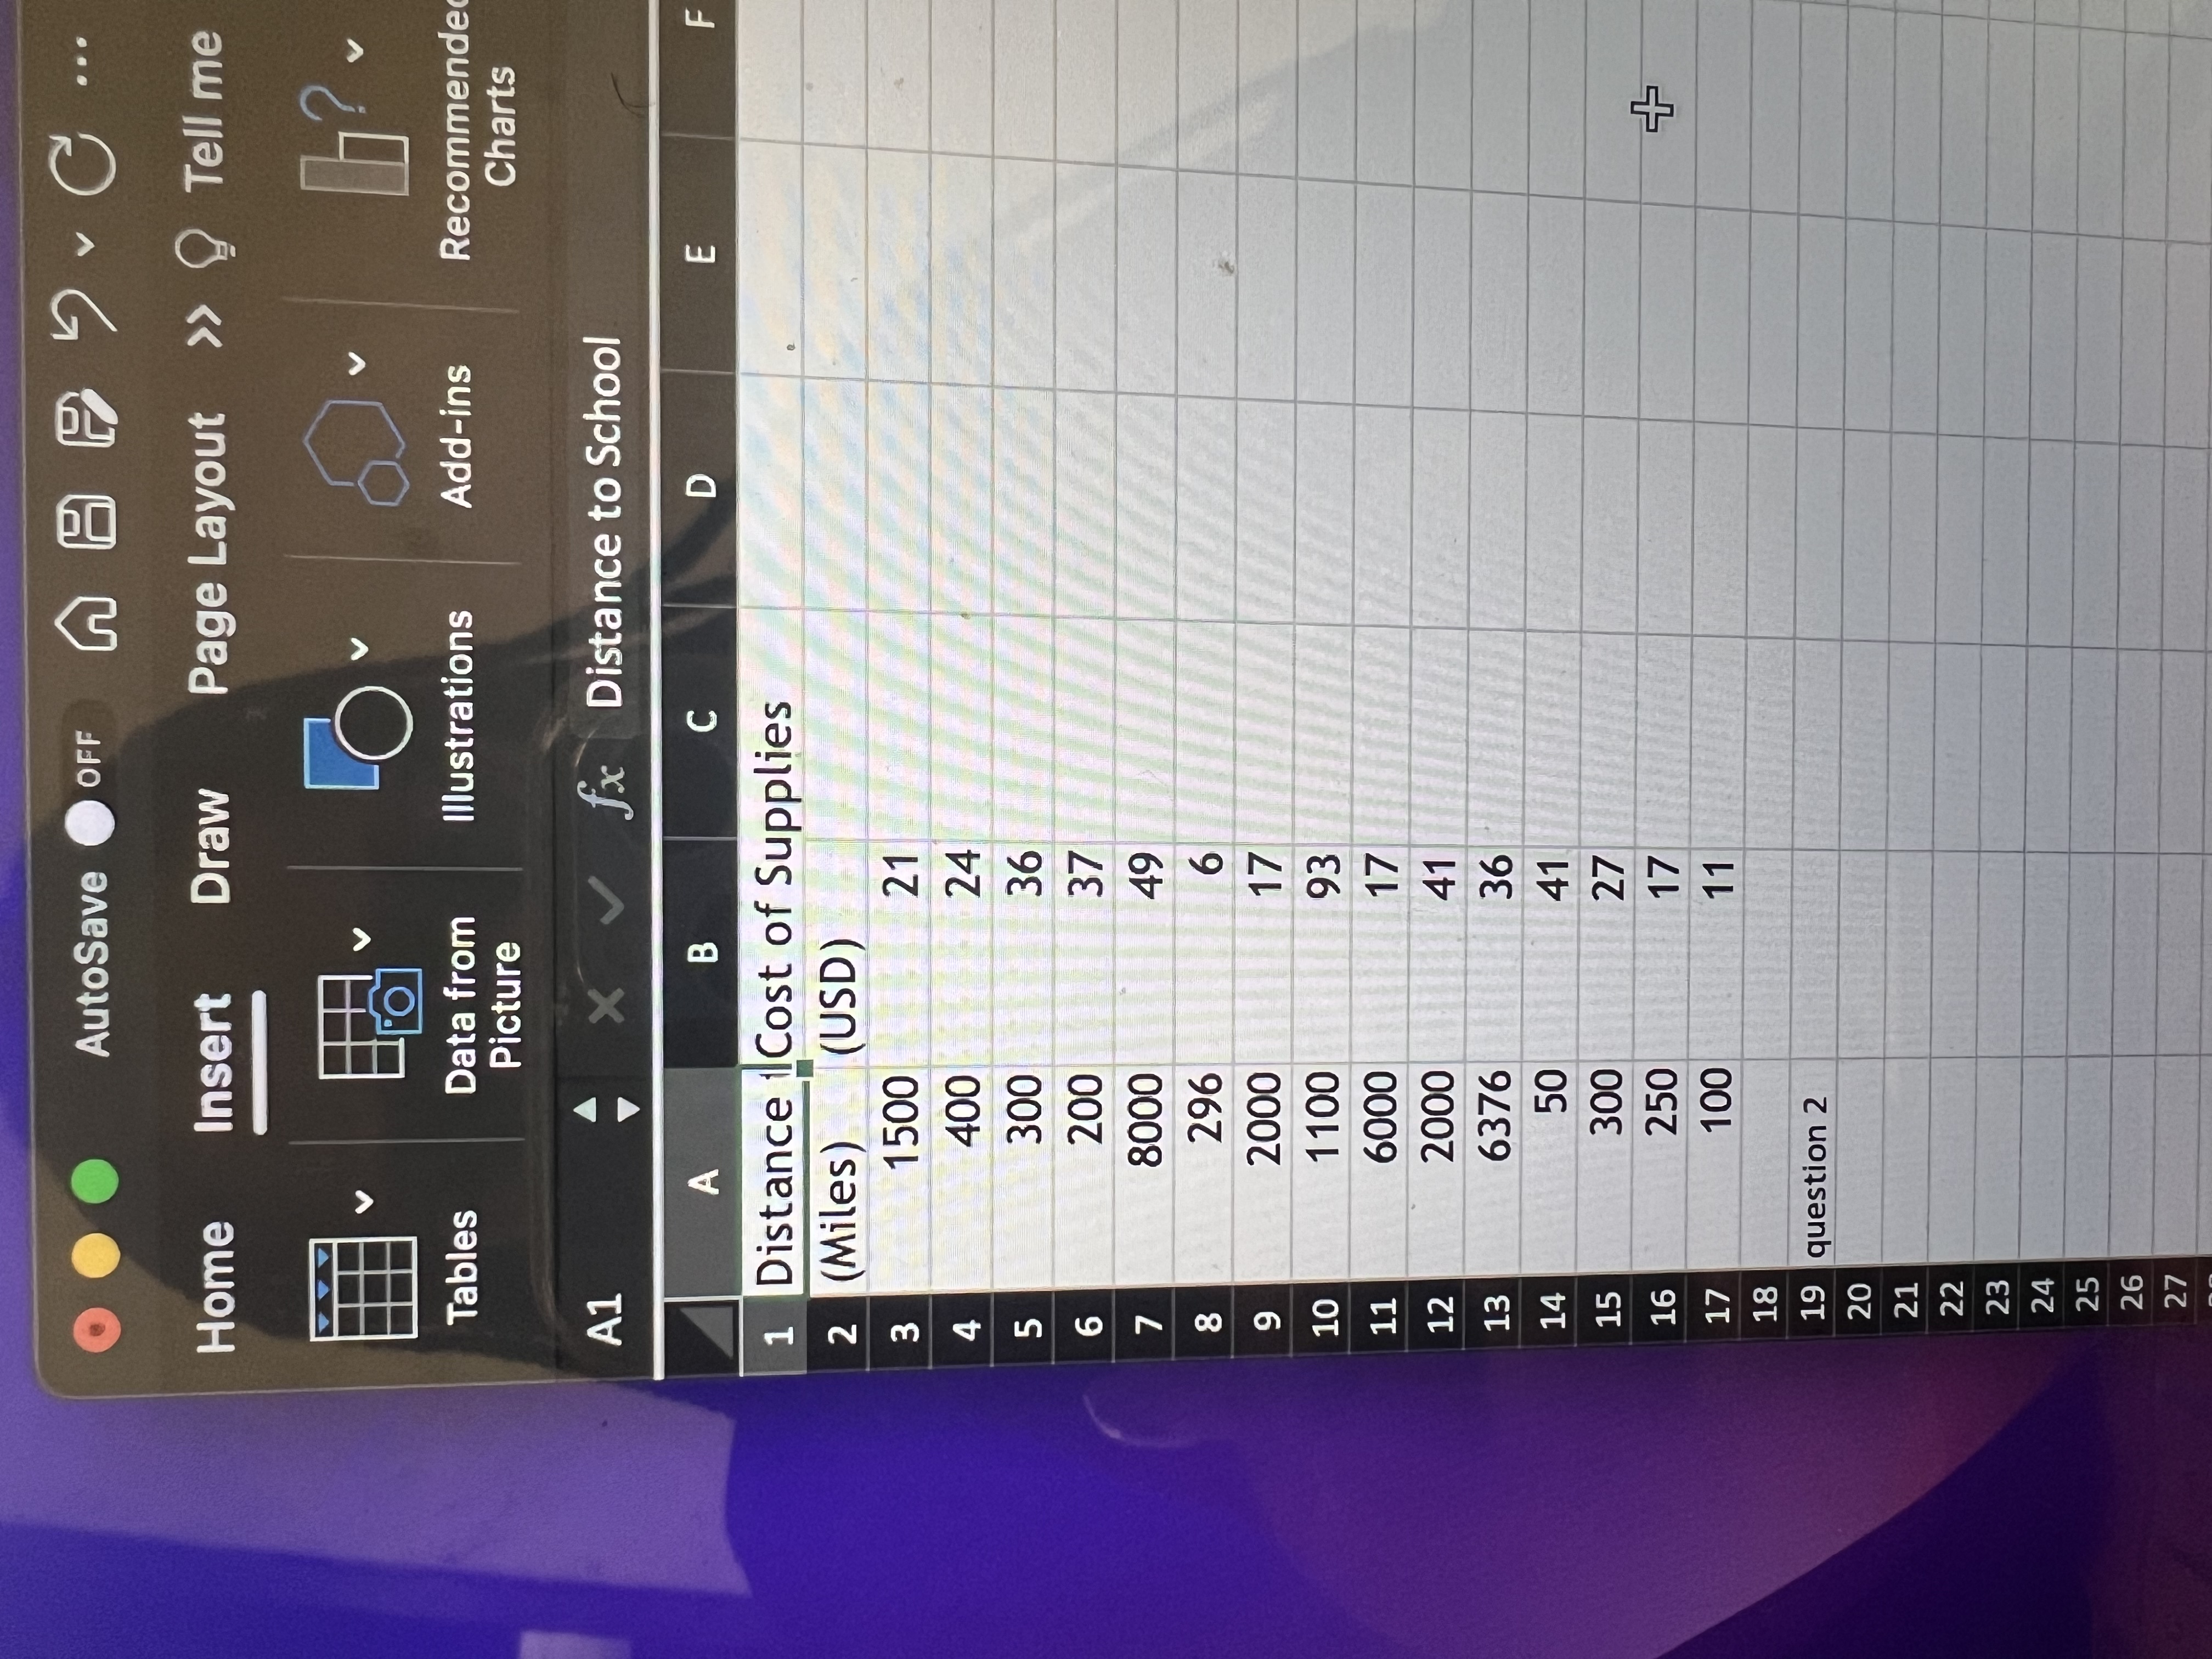
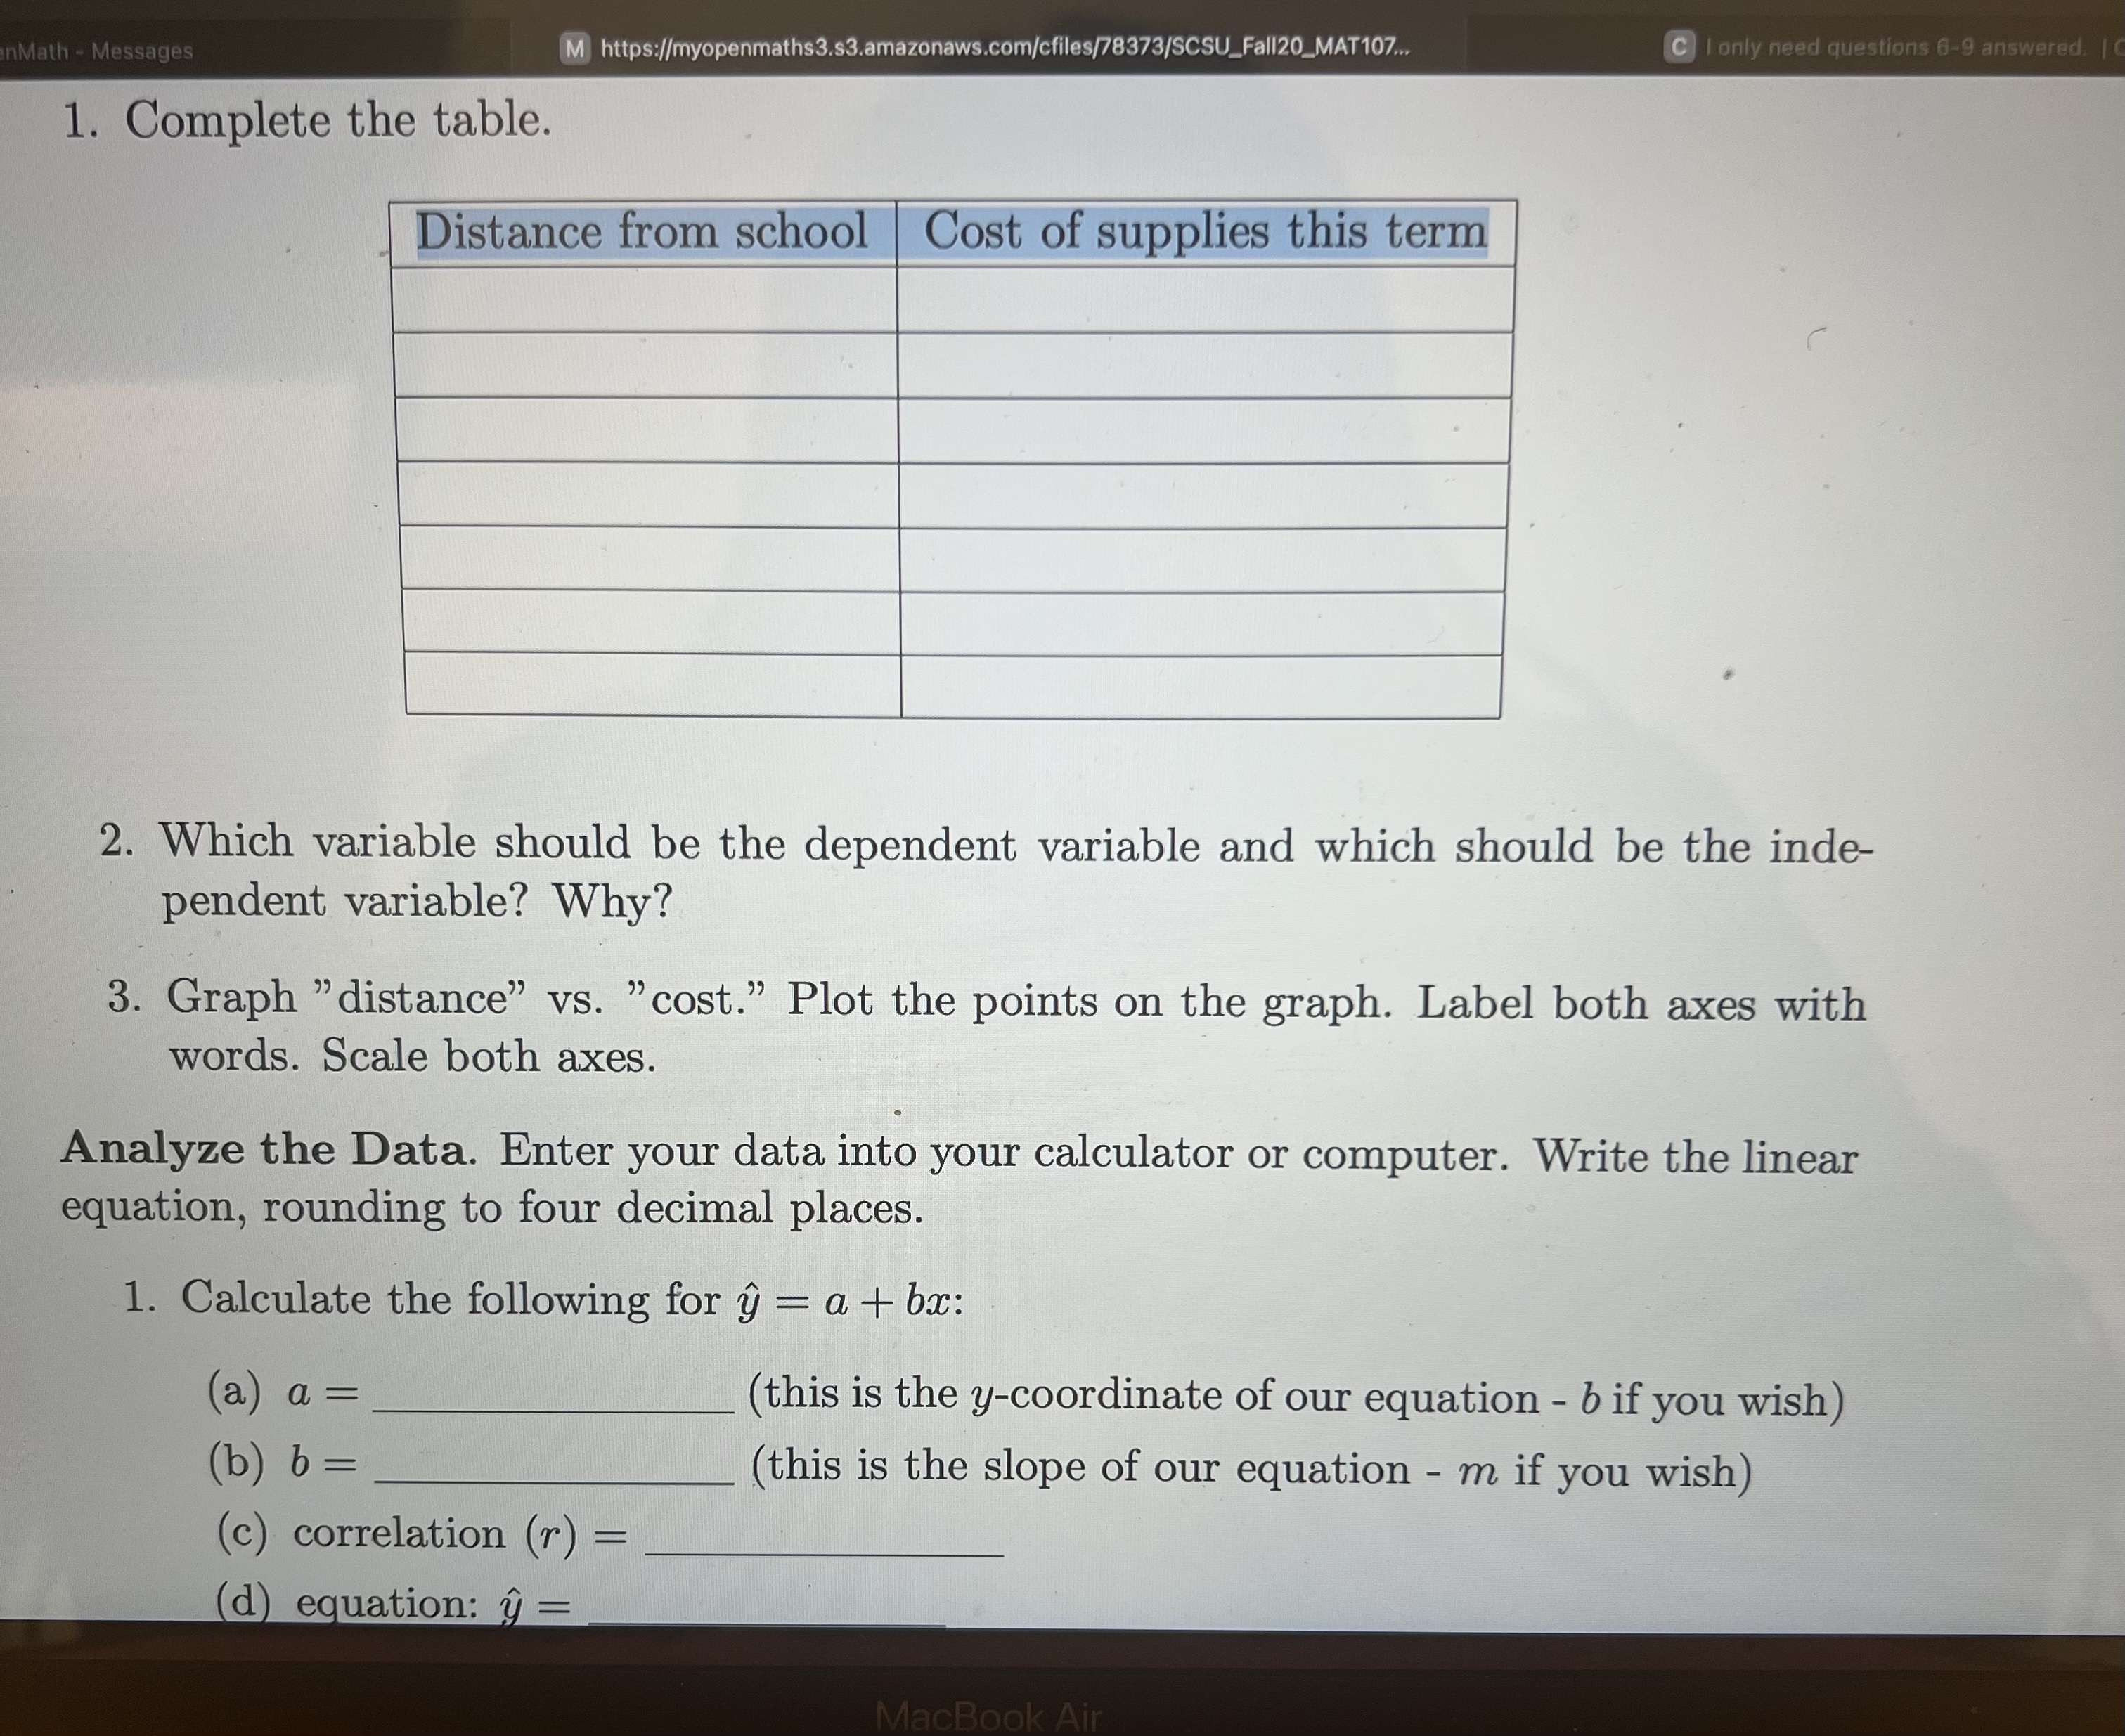
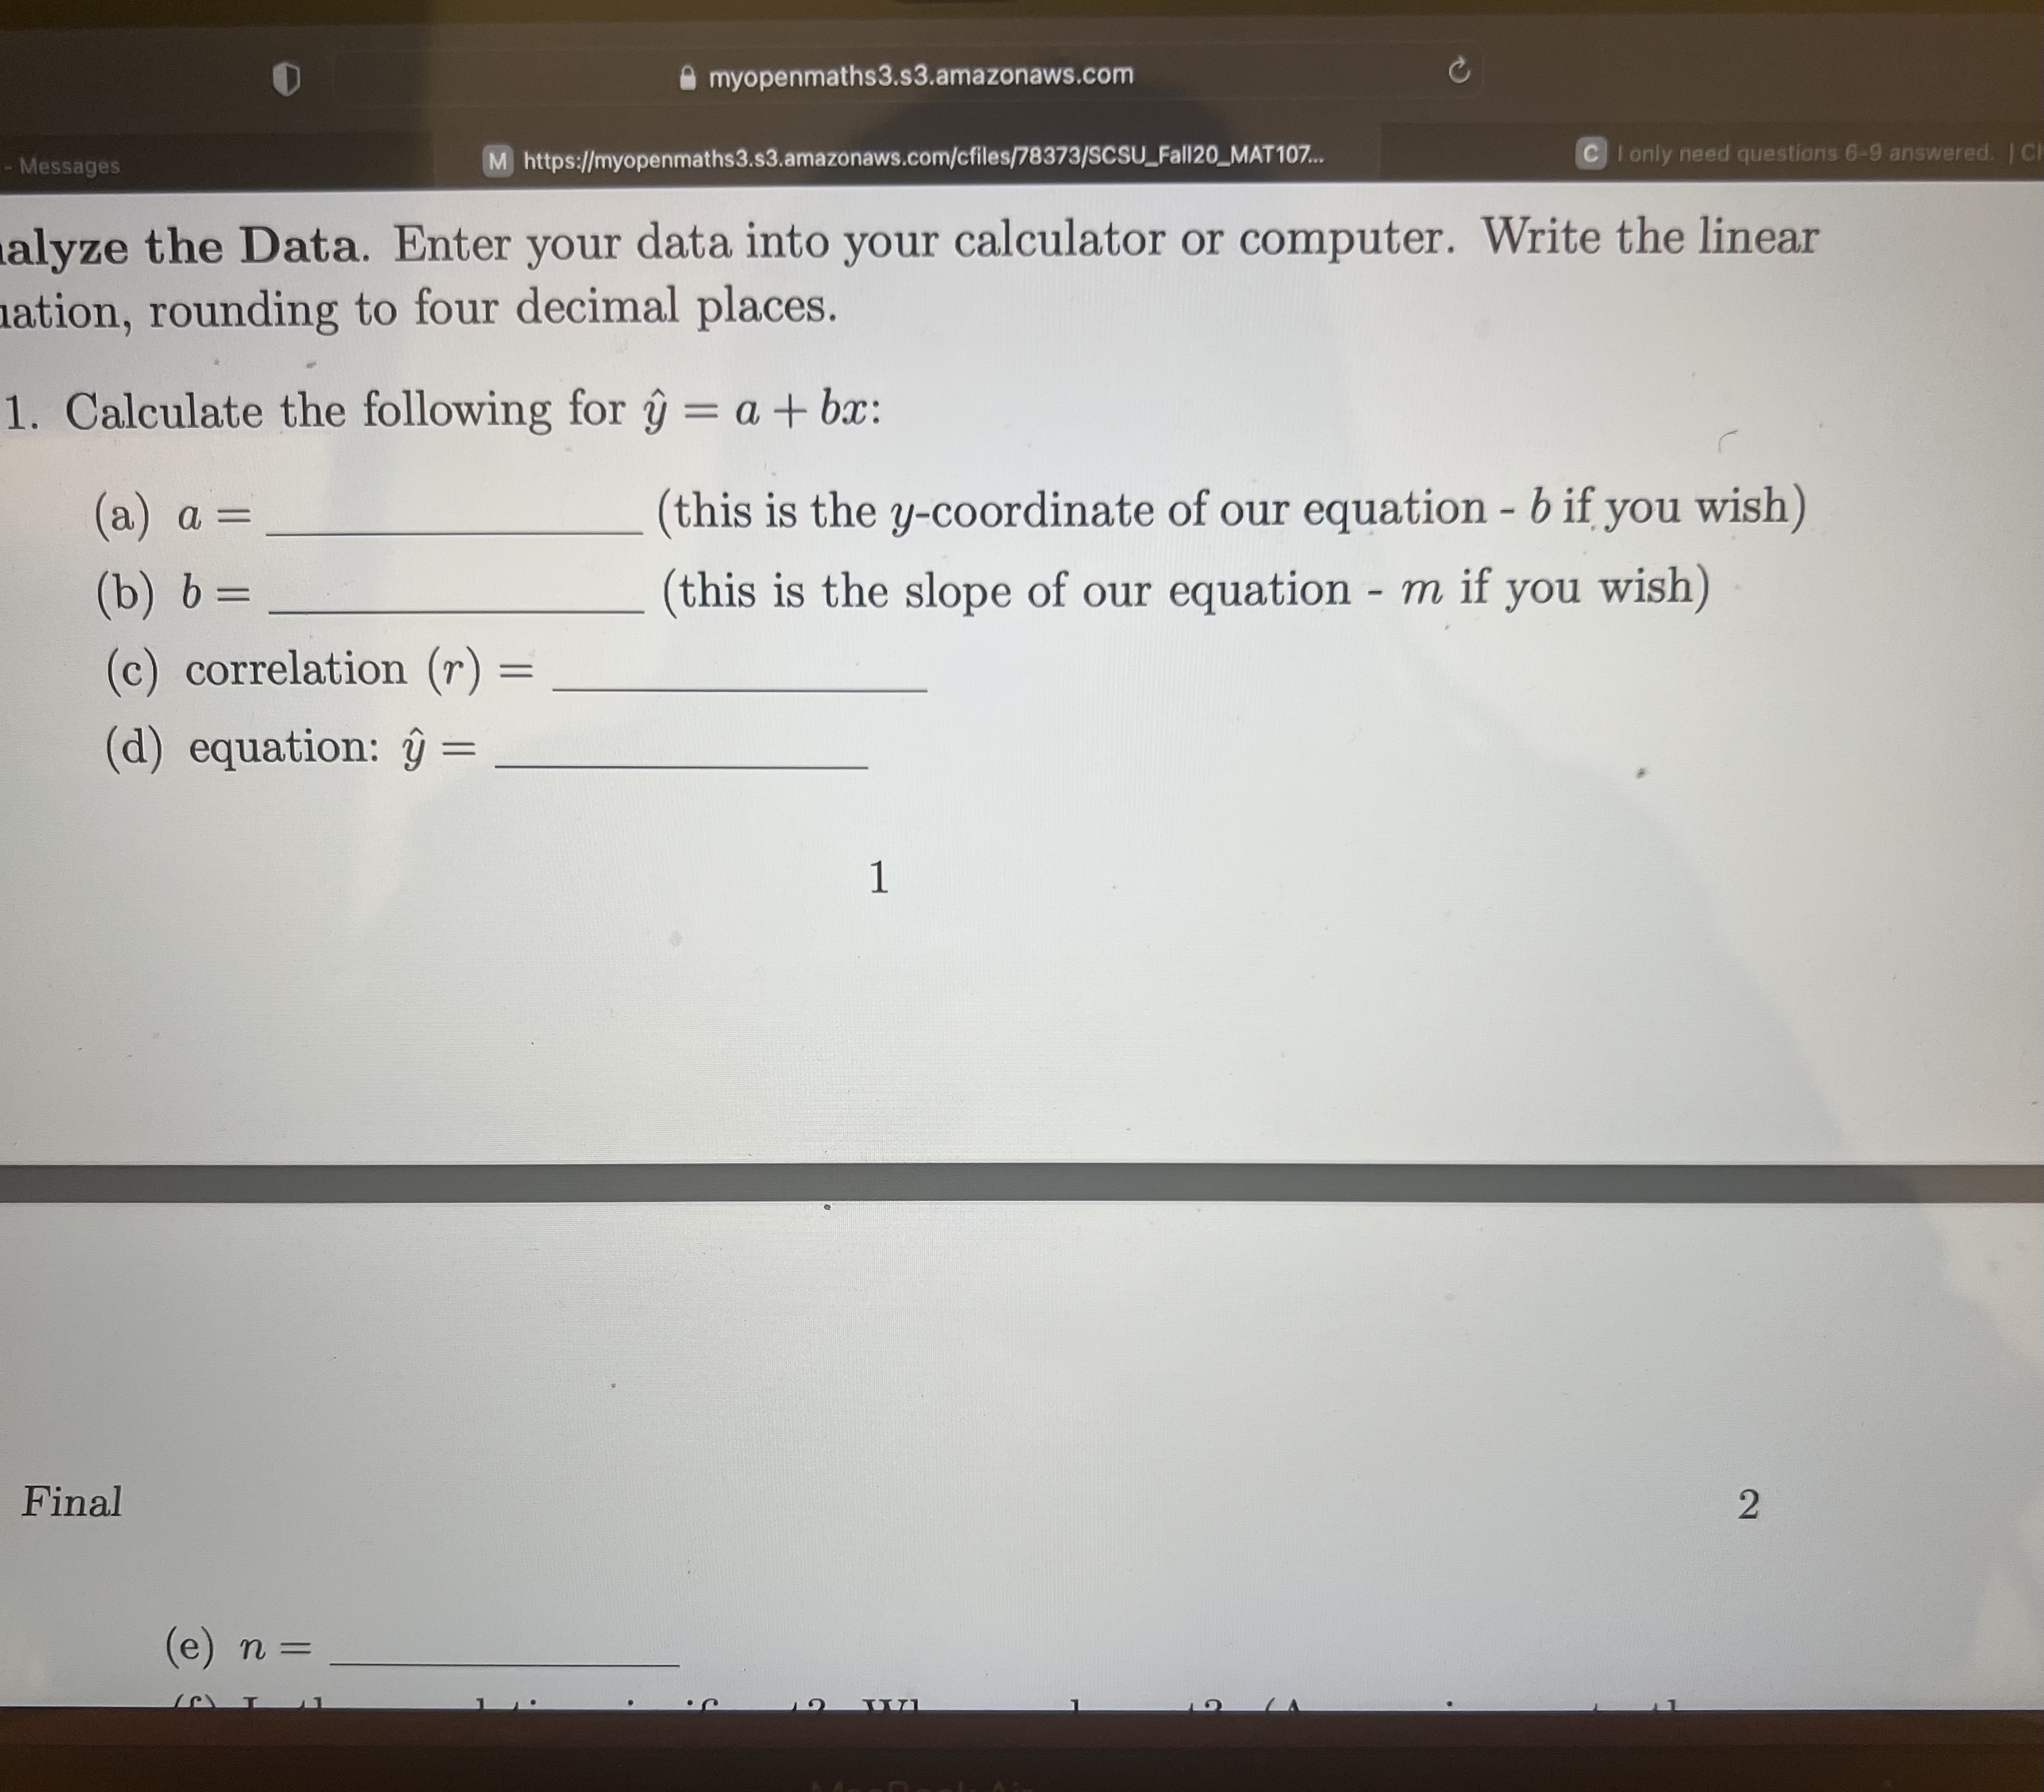

AutoSave OFF ... Home Insert Draw Page Layout >> Tell me h?. Tables Data from Illustrations Add-ins Recommended Picture Charts A1 X V fx Distance to School A B C D E F 1 Distance Cost of Supplies 2 (Miles) (USD) 3 1500 21 A 400 24 5 300 36 6 200 37 7 8000 49 8 296 6 9 2000 17 10 1100 93 11 6000 17 12 2000 41 13 6376 36 14 50 41 15 300 27 16 250 17 17 100 11 18 19 question 2 20 21 22 23 24 25 26 27nMath - Messages M https://myopenmaths3.s3.amazonaws.com/cfiles/78373/SCSU_Fall20_MAT107. C I only need questions 6-9 answered. | 1. Complete the table. Distance from school |Cost of supplies this term 2. Which variable should be the dependent variable and which should be the inde- pendent variable? Why? 3. Graph "distance" vs. "cost." Plot the points on the graph. Label both axes with words. Scale both axes. Analyze the Data. Enter your data into your calculator or computer. Write the linear equation, rounding to four decimal places. 1. Calculate the following for y = a + bx: (a) a= (this is the y-coordinate of our equation - b if you wish) ( b) b = (this is the slope of our equation - m if you wish) correlation (r) = (d) equation: y =myopenmaths3.s3.amazonaws.com C Messages M https://myopenmaths3.s3.amazonaws.com/cfiles/78373/SCSU_Fall20_MAT107. C I only need questions 6-9 answered. | c alyze the Data. Enter your data into your calculator or computer. Write the linear ation, rounding to four decimal places. 1. Calculate the following for y = a + bx: (a a = (this is the y-coordinate of our equation - b if you wish) ( b) b = (this is the slope of our equation - m if you wish) (c) correlation (r) = (d) equation: y = Final 2 ( en =1. Answer each question in complete sentences. (a) Does the line seem to fit the data? (b) What does the correlation imply about the relationship beteen the distance and the cost? 2. Are there any outliers? If so, which points is an outlier? 3. Should the outlier, if it exists, be removed? Why or why not?( e) n= (f) Is the correlation significant? Why or why not? (Answer in one to three complete sentences. 2. Supply an answer for the following scenarios: (a) For a person who lives eight miles from campus, predict the total cost of supplies this term: (b) For a person who lives eighty miles form campus, predict the total cost of supplies this term: 3. Obtain the graph on your calculator or computer. Sketch the regression line. Discussion Questions 1. Answer each question in complete sentences. (a) Does the line seem to fit the data? (b) What does the correlation imply about the relationship beteen the distance and the cost
Step by Step Solution
There are 3 Steps involved in it

Get step-by-step solutions from verified subject matter experts