

Question: If possible solution preferd on XL show plug ins illustrations Pivot Table Recommended Table Pivot Tables My Add-ins Recommended Charts Tables Add-ins Charts J16 G
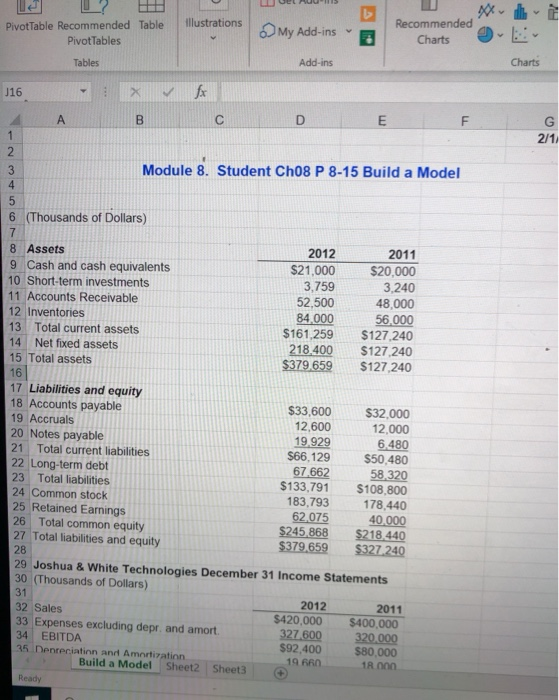
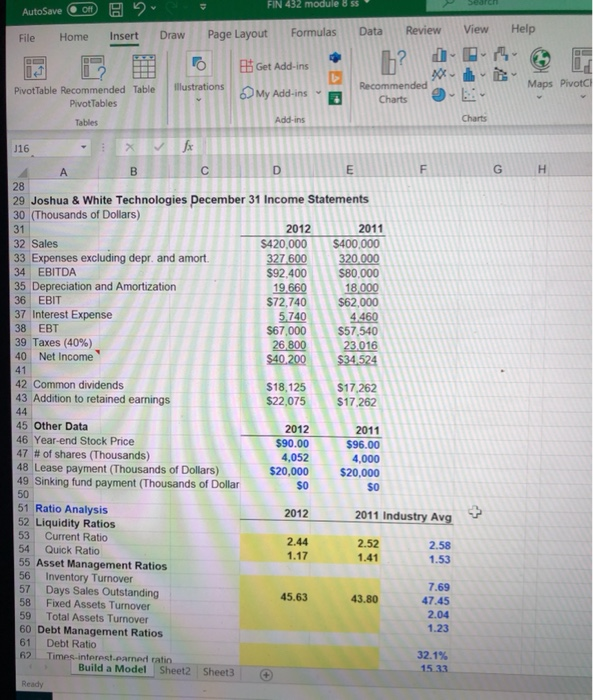
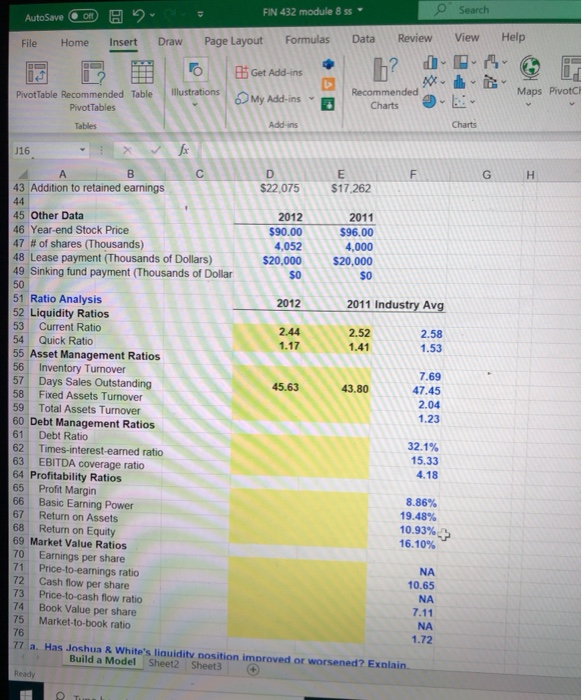
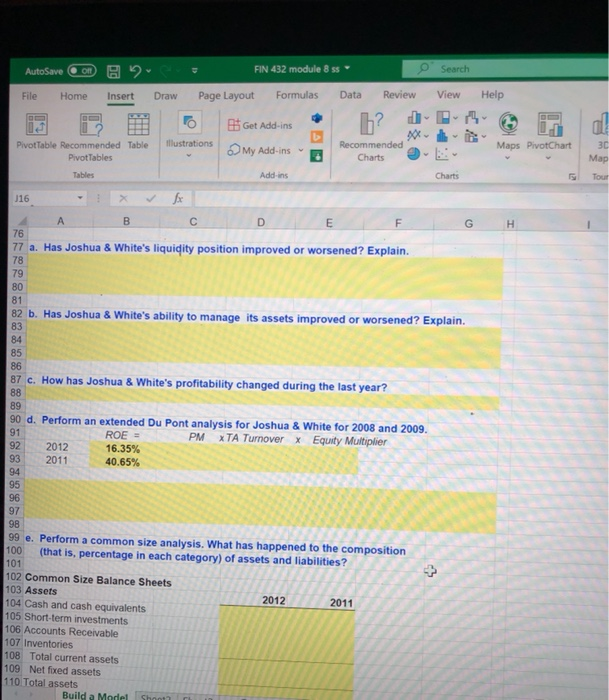
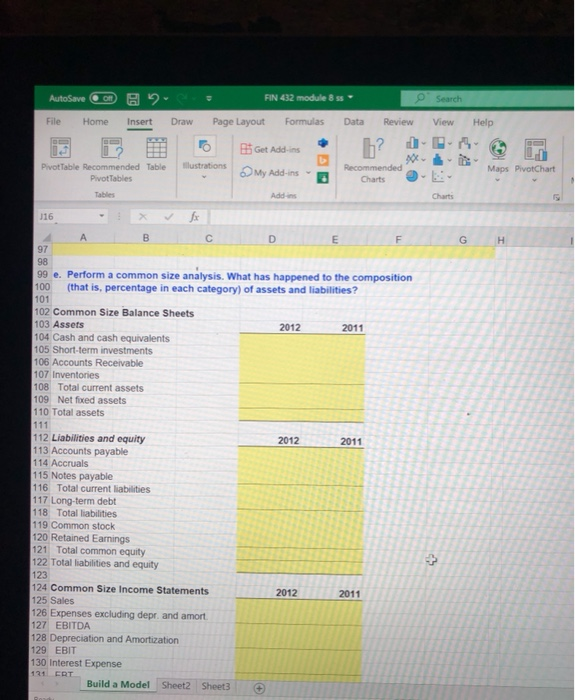
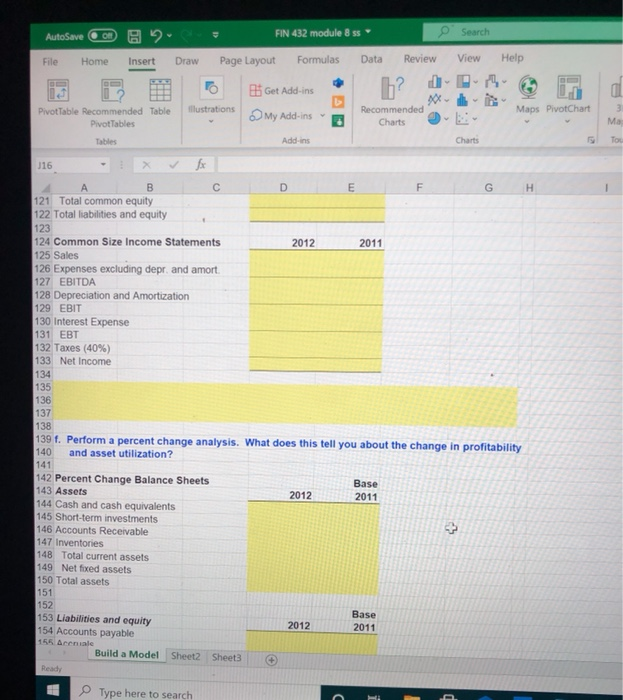
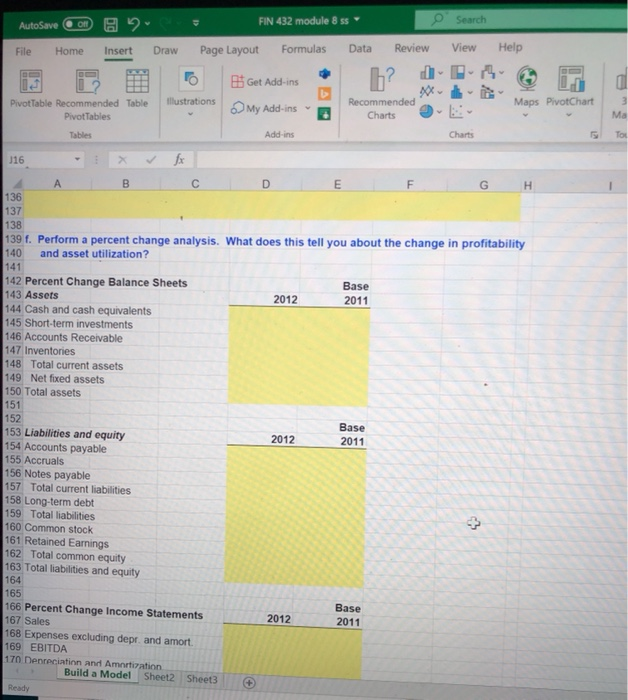
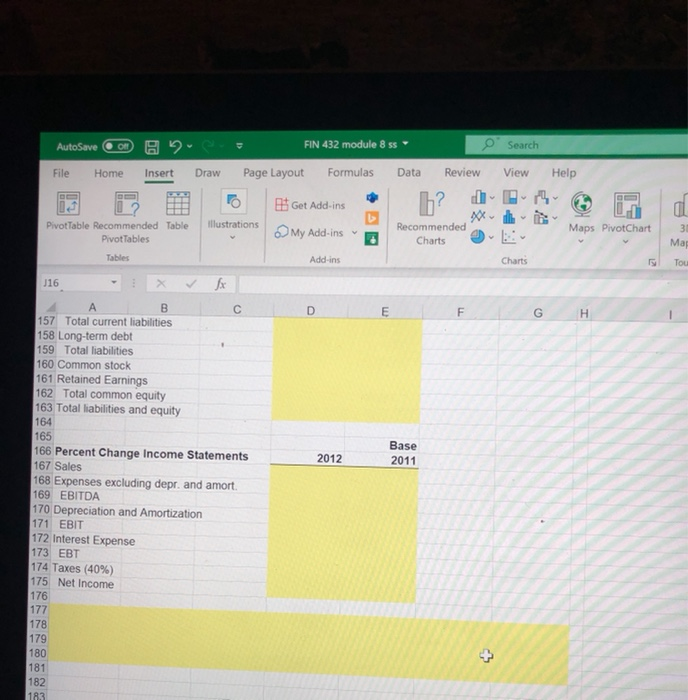
illustrations Pivot Table Recommended Table Pivot Tables My Add-ins Recommended Charts Tables Add-ins Charts J16 G 2/1) A B D F 1 2 3 Module 8. Student Ch08 P 8-15 Build a Model 4 5 6 (Thousands of Dollars) 7 8 Assets 2012 2011 9 Cash and cash equivalents $21,000 $20,000 10 Short-term investments 3,759 3.240 11 Accounts Receivable 52,500 48,000 12 Inventories 84.000 56.000 13 Total current assets $161.259 $127.240 14 Net fixed assets 218,400 $127.240 15 Total assets $379 659 $127.240 16 17 Liabilities and equity 18 Accounts payable $33,600 $32,000 19 Accruals 12,600 12,000 20 Notes payable 19.929 6.480 21 Total current liabilities $66.129 $50,480 22 Long-term debt 67 662 58,320 23 Total liabilities $133,791 $108.800 24 Common stock 183,793 178,440 25 Retained Earnings 62.075 40.000 26 Total common equity $245,868 $218.440 27 Total liabilities and equity $379,659 $327 240 28 29 Joshua & White Technologies December 31 Income Statements 30 (Thousands of Dollars) 31 2012 32 Sales 2011 $420,000 33 Expenses excluding depr. and amort. $400,000 327.600 34 EBITDA 320.000 35 Depreciation and Amortization $92,400 $80.000 10 60 Build a Model 12 000 Sheet2 Sheet Ready AutoSave Off FIN 432 module 85 Draw Data Home Formulas Page Layout File Insert View Review Help o Get Add-ins - - XX Recommended Charts illustrations Maps Pivot Pivot Table Recommended Table Pivot Tables My Add-ins Tables Add-ins Charts J16 G H B D E F 28 29 Joshua & White Technologies December 31 Income Statements 30 (Thousands of Dollars) 31 2012 2011 32 Sales $420,000 $400,000 33 Expenses excluding depr. and amort. 327 600 320 000 34 EBITDA $92,400 $80,000 35 Depreciation and Amortization 19.660 18000 36 EBIT $72,740 $62,000 37 Interest Expense 5740 4460 38 EBT $67,000 $57,540 39 Taxes (40%) 26.800 23.016 40 Net Income $40.200 $34.524 41 42 Common dividends $18,125 $17,262 43 Addition to retained earnings $22.075 $17.262 44 45 Other Data 2012 2011 46 Year-end Stock Price $90.00 $96.00 47 # of shares (Thousands) 4,052 4,000 48 Lease payment (Thousands of Dollars) $20,000 $20,000 49 Sinking fund payment (Thousands of Dollar $0 SO 50 51 Ratio Analysis 2012 2011 Industry Avg 52 Liquidity Ratios 53 Current Ratio 2.44 2.52 2.58 54 Quick Ratio 1.17 1.41 1.53 55 Asset Management Ratios 56 Inventory Turnover 57 Days Sales Outstanding 7.69 45.63 43.80 58 47.45 Fixed Assets Turnover 59 Total Assets Turnover 2.04 60 Debt Management Ratios 1.23 61 Debt Ratio 62 Times.interest.earned ratio 32.1% Build a Model Sheet2 Sheet3 15.33 Ready 4 AutoSave OM FIN 432 module 8 ss O Search 2 File Home Insert Draw Page Layout Formulas Data Review View Help 1 Bi Get Add-ins My Add-ins Illustrations Pivot Table Recommended Table Pivot Tables Recommended Charts Maps Pivot Tables Add-ins Charts G H J16 B D E F 43 Addition to retained earnings $22,075 $17,262 44 45 Other Data 2012 2011 46 Year-end Stock Price $90.00 $96.00 47 # of shares (Thousands) 4,052 4,000 48 Lease payment (Thousands of Dollars) $20,000 $20,000 49 Sinking fund payment (Thousands of Dollar SO $0 50 51 Ratio Analysis 2012 2011 Industry Avg 52 Liquidity Ratios 53 Current Ratio 2.44 2.52 2.58 54 Quick Ratio 1.17 1.41 1.53 55 Asset Management Ratios 56 Inventory Turnover 7.69 57 Days Sales Outstanding 45.63 43.80 47.45 58 Fixed Assets Turnover 2.04 59 Total Assets Turnover 1.23 60 Debt Management Ratios 61 Debt Ratio 32.1% 62 Times-interest-earned ratio 15.33 63 EBITDA coverage ratio 4.18 64 Profitability Ratios 65 Profit Margin 8.86% 66 Basic Earning Power 67 Return on Assets 19.48% 68 Return on Equity 69 Market Value Ratios 16.10% 70 Earnings per share 71 Price-to-earnings ratio NA 72 Cash flow per share 10.65 73 Price-to-cash flow ratio NA 74 Book Value per share 7.11 75 Market-to-book ratio NA 76 1.72 77 a. Has Joshua & White's liquidity position improved or worsened? Explain Build a Model Sheet2 Sheet3 Ready 10.93% AutoSave ON FIN 432 module 8 ss e' Search File Home Insert Draw Page Layout Formulas Data Review View Help h? al illustrations Ett Get Add-ins My Add-ins Pivot Table Recommended Table Pivot Tables 30 Recommended Charts Maps PivotChart Map Tables Add-ins Charts Tour J16 fx A B D E F G H 76 77 a. Has Joshua & White's liquidity position improved or worsened? Explain. 78 79 80 81 82 b. Has Joshua & White's ability to manage its assets improved or worsened? Explain. 83 84 85 86 87 c. How has Joshua & White's profitability changed during the last year? 88 89 90 d. Perform an extended Du Pont analysis for Joshua & White for 2008 and 2009. 91 ROE = PM XTA Turnover x Equity Multiplier 92 2012 16.35% 93 2011 40.65% 94 95 96 97 98 99 e. Perform a common size analysis. What has happened to the composition 100 (that is, percentage in each category) of assets and liabilities? 101 102 Common Size Balance Sheets 103 Assets 104 Cash and cash equivalents 2012 2011 105 Short-term investments 106 Accounts Receivable 107 Inventories 108 Total current assets 109 Net fixed assets 110 Total assets Build a Model 4 AutoSave Olt 8 FIN 432 module 8 s. e Search File Home Insert Draw Page Layout Formulas Data Review View Help Bit Get Add-ins My Add-ins * Hlustrations Pivot Table Recommended Table Pivot Tables Tables Recommended Charts Maps PivotChart Add Charts 116 fx G H B D E F 97 98 99 e. Perform a common size analysis. What has happened to the composition 100 (that is, percentage in each category) of assets and liabilities? 101 102 Common Size Balance Sheets 103 Assets 2012 2011 104 Cash and cash equivalents 105 Short-term investments 106 Accounts Receivable 107 Inventories 108 Total current assets 109 Net foxed assets 110 Total assets 111 112 Liabilities and equity 2012 2011 113 Accounts payable 114 Accruals 115 Notes payable 116 Total current liabilities 117 Long-term debt 118 Total liabilities 119 Common stock 120 Retained Earnings 121 Total common equity 122 Total liabilities and equity 123 124 Common Size Income Statements 2012 2011 125 Sales 126 Expenses excluding depr. and amort. 127 EBITDA 128 Depreciation and Amortization 129 EBIT 130 Interest Expense 1121 ERT Build a Model Sheet2 Sheet3 + AutoSave Om FIN 432 module 8 ss e' Search File Home Insert Draw Page Layout Formulas Data Review View Help 19 b? Illustrations Get Add-ins My Add-ins Maps PivotChart Pivot Table Recommended Table Pivot Tables Recommended Charts 3 Tables Add-ins Charts To J16 > A B D E F G H 121 Total common equity 122 Total liabilities and equity 123 124 Common Size Income Statements 2012 2011 125 Sales 126 Expenses excluding depr and amort. 127 EBITDA 128 Depreciation and Amortization 129 EBIT 130 Interest Expense 131 EBT 132 Taxes (40%) 133 Net Income 134 135 136 137 138 139 t. Perform a percent change analysis. What does this tell you about the change in profitability 140 and asset utilization? 141 142 Percent Change Balance Sheets Base 143 Assets 2012 2011 144 Cash and cash equivalents 145 Short-term investments 146 Accounts Receivable 147 Inventories 148 Total current assets 149 Net fixed assets 150 Total assets 151 152 Base 153 Liabilities and equity 2012 2011 154 Accounts payable 155 Arenale Build a Model Sheet2 Sheet3 Ready 4 Type here to search AutoSave Of 82 FIN 432 module 8 ss e Search File Home Insert Draw Page Layout Formulas Data Review View Help b? a Et Get Add-ins My Add-ins 19 Illustrations Pivot Table Recommended Table Pivot Tables Recommended Charts Maps PivotChart Ma Tables Add-ins Charts Tox > J16 fx D F G B E H 136 137 138 139 f. Perform a percent change analysis. What does this tell you about the change in profitability 140 and asset utilization? 141 142 Percent Change Balance Sheets Base 143 Assets 2012 2011 144 Cash and cash equivalents 145 Short-term investments 146 Accounts Receivable 147 Inventories 148 Total current assets 149 Net fixed assets 150 Total assets 151 152 Base 153 Liabilities and equity 2012 2011 154 Accounts payable 155 Accruals 156 Notes payable 157 Total current liabilities 158 Long-term debt 159 Total liabilities 160 Common stock 161 Retained Earnings 162 Total common equity 163 Total liabilities and equity 164 165 Base 166 Percent Change Income Statements 2012 2011 167 Sales 168 Expenses excluding depr. and amort. 169 EBITDA 170 Depreciation and Amortization Build a Model Sheet2 Sheet3 Ready AutoSave CH O' Search FIN 432 module 8 ss Page Layout Formulas Data File Home Insert Draw Review View Help b? illustrations Ett Get Add-ins My Add-ins Pivot Table Recommended Table Pivot Tables Recommended Charts Maps PivotChart a 31 Tables Add-ins Charts Tou J16 fx D E F G H 2012 Base 2011 B 157 Total current liabilities 158 Long-term debt 159 Total liabilities 160 Common stock 161 Retained Earnings 162 Total common equity 163 Total liabilities and equity 164 165 166 Percent Change Income Statements 167 Sales 168 Expenses excluding depr. and amort. 169 EBITDA 170 Depreciation and Amortization 171 EBIT 172 Interest Expense 173 EBT 174 Taxes (40%) 175 Net Income 176 177 178 179 180 181 182 183
Step by Step Solution
There are 3 Steps involved in it

Get step-by-step solutions from verified subject matter experts