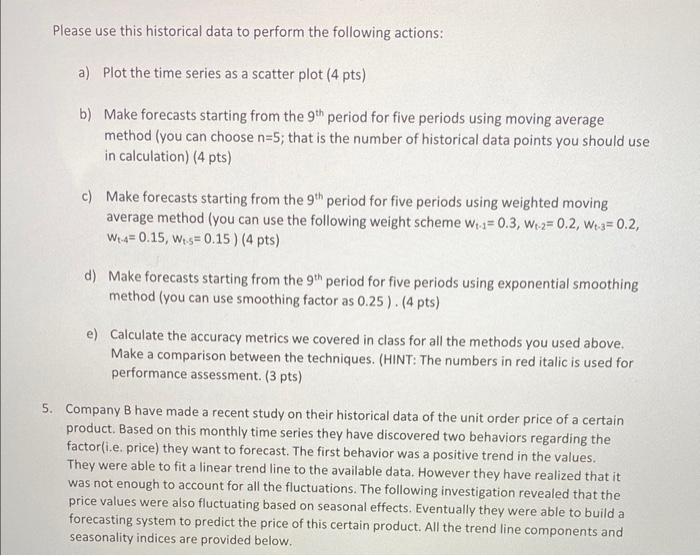
Question: average method (you can use the following weight scheme wt1=0.3,wt2=0.2,wt3=0.2, wt4=0.15,wt.5=0.15) ( 4pts) d) Make forecasts starting from the 9th period for five periods using

average method (you can use the following weight
average method (you can use the following weight scheme wt1=0.3,wt2=0.2,wt3=0.2, wt4=0.15,wt.5=0.15) ( 4pts) d) Make forecasts starting from the 9th period for five periods using exponential smoothing method (you can use smoothing factor as 0.25). (4 pts) e) Calculate the accuracy metrics we covered in class for all the methods you used above. Make a comparison between the techniques. (HINT: The numbers in red italic is used for performance assessment. (3 pts) 5. Company B have made a recent study on their historical data of the unit order price of a certain product. Based on this monthly time series they have discovered two behaviors regarding the factor(i.e. price) they want to forecast. The first behavior was a positive trend in the values. They were able to fit a linear trend line to the available data. However they have realized that it was not enough to account for all the fluctuations. The following investigation revealed that the price values were also fluctuating based on seasonal effects. Eventually they were able to build a forecasting system to predict the price of this certain product. All the trend line components and seasonality indices are provided below. Please make predictions for the next ten periods using the derived forecasting system. You may assume the first period you start forecasting is associated with season 1. (Generating trend based portion is 4 pts; Correctly adding seasonal factors to it is 4 pts) average method (you can use the following weight scheme wt1=0.3,wt2=0.2,wt3=0.2, wt4=0.15,wt.5=0.15) ( 4pts) d) Make forecasts starting from the 9th period for five periods using exponential smoothing method (you can use smoothing factor as 0.25). (4 pts) e) Calculate the accuracy metrics we covered in class for all the methods you used above. Make a comparison between the techniques. (HINT: The numbers in red italic is used for performance assessment. (3 pts) 5. Company B have made a recent study on their historical data of the unit order price of a certain product. Based on this monthly time series they have discovered two behaviors regarding the factor(i.e. price) they want to forecast. The first behavior was a positive trend in the values. They were able to fit a linear trend line to the available data. However they have realized that it was not enough to account for all the fluctuations. The following investigation revealed that the price values were also fluctuating based on seasonal effects. Eventually they were able to build a forecasting system to predict the price of this certain product. All the trend line components and seasonality indices are provided below. Please make predictions for the next ten periods using the derived forecasting system. You may assume the first period you start forecasting is associated with season 1. (Generating trend based portion is 4 pts; Correctly adding seasonal factors to it is 4 pts)

Step by Step Solution

There are 3 Steps involved in it

1 Expert Approved Answer
Step: 1 Unlock blur-text-image
Question Has Been Solved by an Expert!

Get step-by-step solutions from verified subject matter experts

Step: 2 Unlock
Step: 3 Unlock

Students Have Also Explored These Related General Management Questions!