

Question: Use the data given to calculate annual returns for Bartman, Reynolds, and the Wilshire 5000 Index, and then calculate average returns over the 5-year period.
-
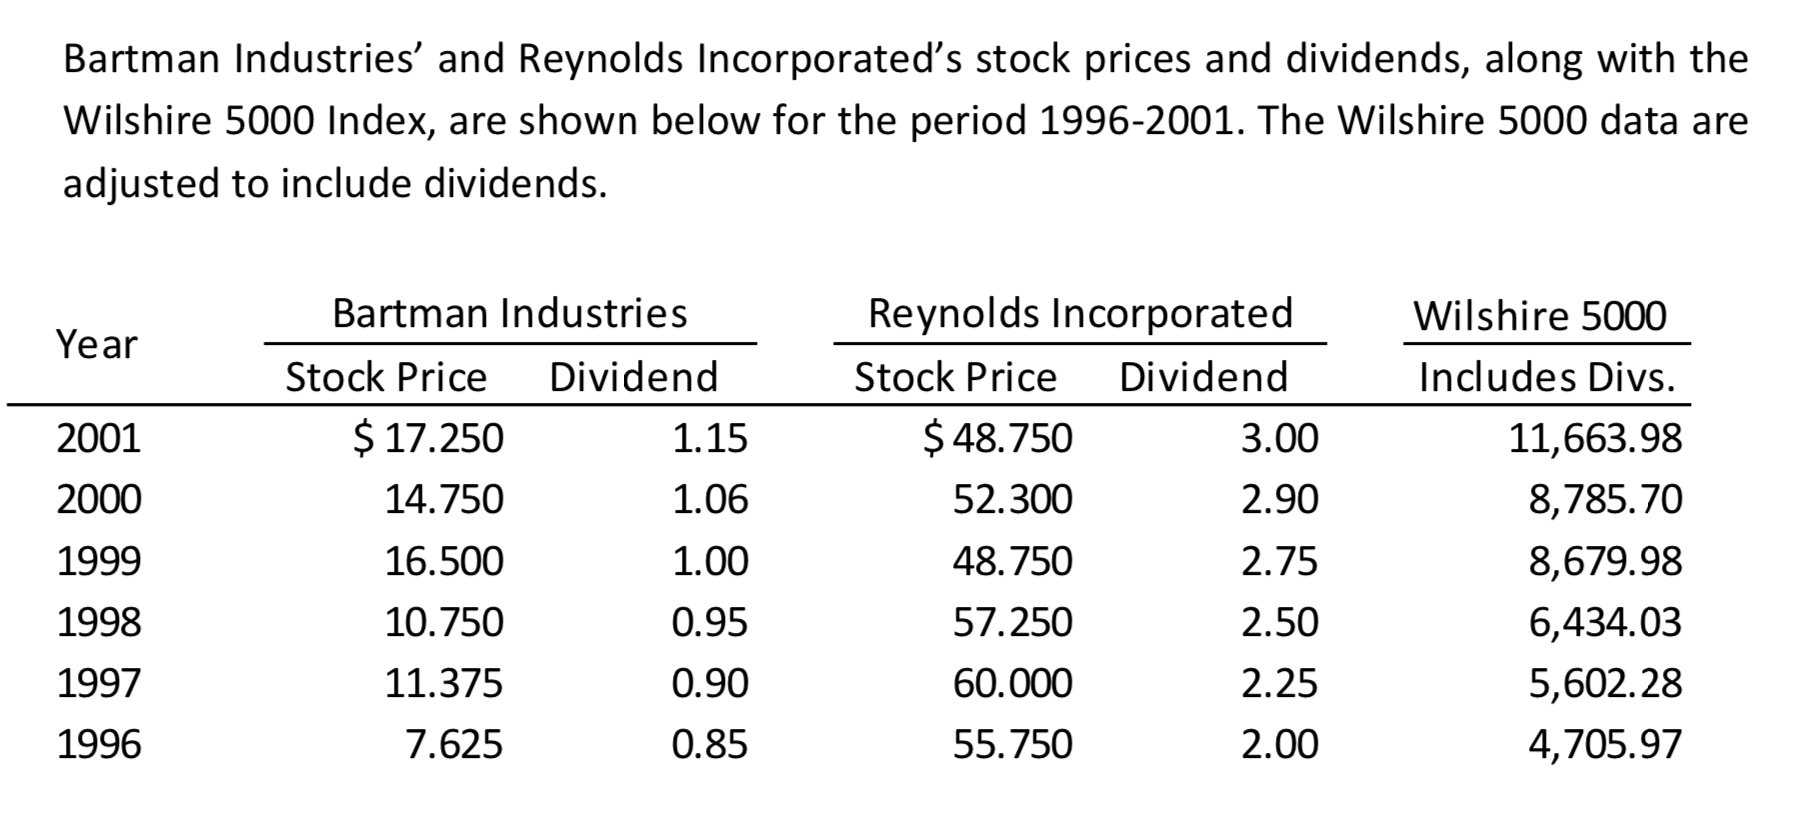
Use the data given to calculate annual returns for Bartman, Reynolds, and the Wilshire 5000 Index, and then calculate average returns over the 5-year period. (Hint: Remember, returns are calculated by subtracting the beginning price from the ending price to get the capital gain or loss, adding the dividend to the capital gain or loss and dividing the result by the beginning price. Assume that dividends are already included in the index. Also, you cannot calculate the rate of return for 1996 because you do not have 1995 data).
Bartman Industries' and Reynolds Incorporated's stock prices and dividends, along with the Wilshire 5000 Index, are shown below for the period 1996-2001. The Wilshire 5000 data are adjusted to include dividends. Year 2001 2000 1999 1998 1997 1996 Bartman Industries Stock Price Dividend $ 17.250 1.15 14.750 1.06 16.500 1.00 10.750 0.95 11.375 0.90 7.625 0.85 Reynolds Incorporated Stock Price Dividend $ 48.750 3.00 52.300 2.90 48.750 2.75 57.250 60.000 2.25 55.750 2.00 Wilshire 5000 Includes Divs. 11,663.98 8,785.70 8,679.98 6,434.03 5,602.28 4,705.97 2.50
Step by Step Solution
There are 3 Steps involved in it

Get step-by-step solutions from verified subject matter experts