

Question: b 2.S.23 Here is a histogram. 10 20 40 60 80 100 Explain why the mean is less than the median of the distribution.
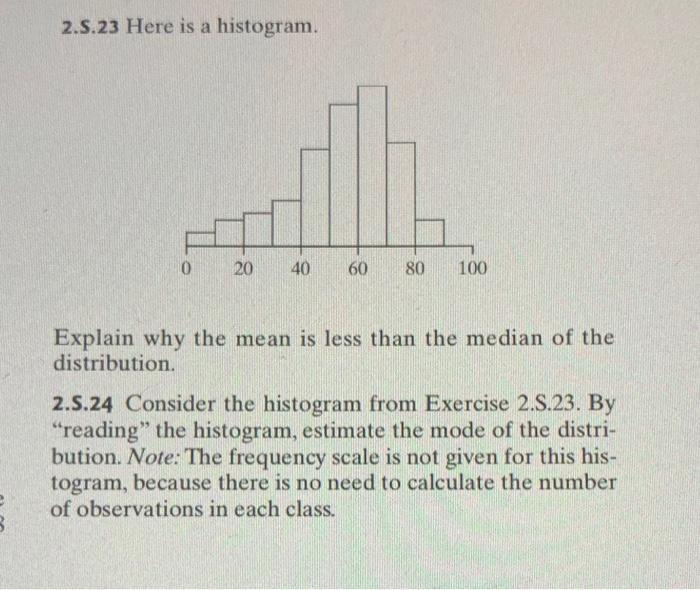
b 2.S.23 Here is a histogram. 10 20 40 60 80 100 Explain why the mean is less than the median of the distribution. 2.S.24 Consider the histogram from Exercise 2.S.23. By "reading" the histogram, estimate the mode of the distri- bution. Note: The frequency scale is not given for this his- togram, because there is no need to calculate the number of observations in each class.
Step by Step Solution
★★★★★
3.42 Rating (149 Votes )
There are 3 Steps involved in it
1 Expert Approved Answer
Step: 1 Unlock

2S23 It is a left skewed distribution the lef... View full answer
Question Has Been Solved by an Expert!
Get step-by-step solutions from verified subject matter experts
Step: 2 Unlock
Step: 3 Unlock