

Question: B 9 10 ch 0 III K < Question 10 of 10 > This test: 100 point(s) possible This question: 10 point(s) possible The
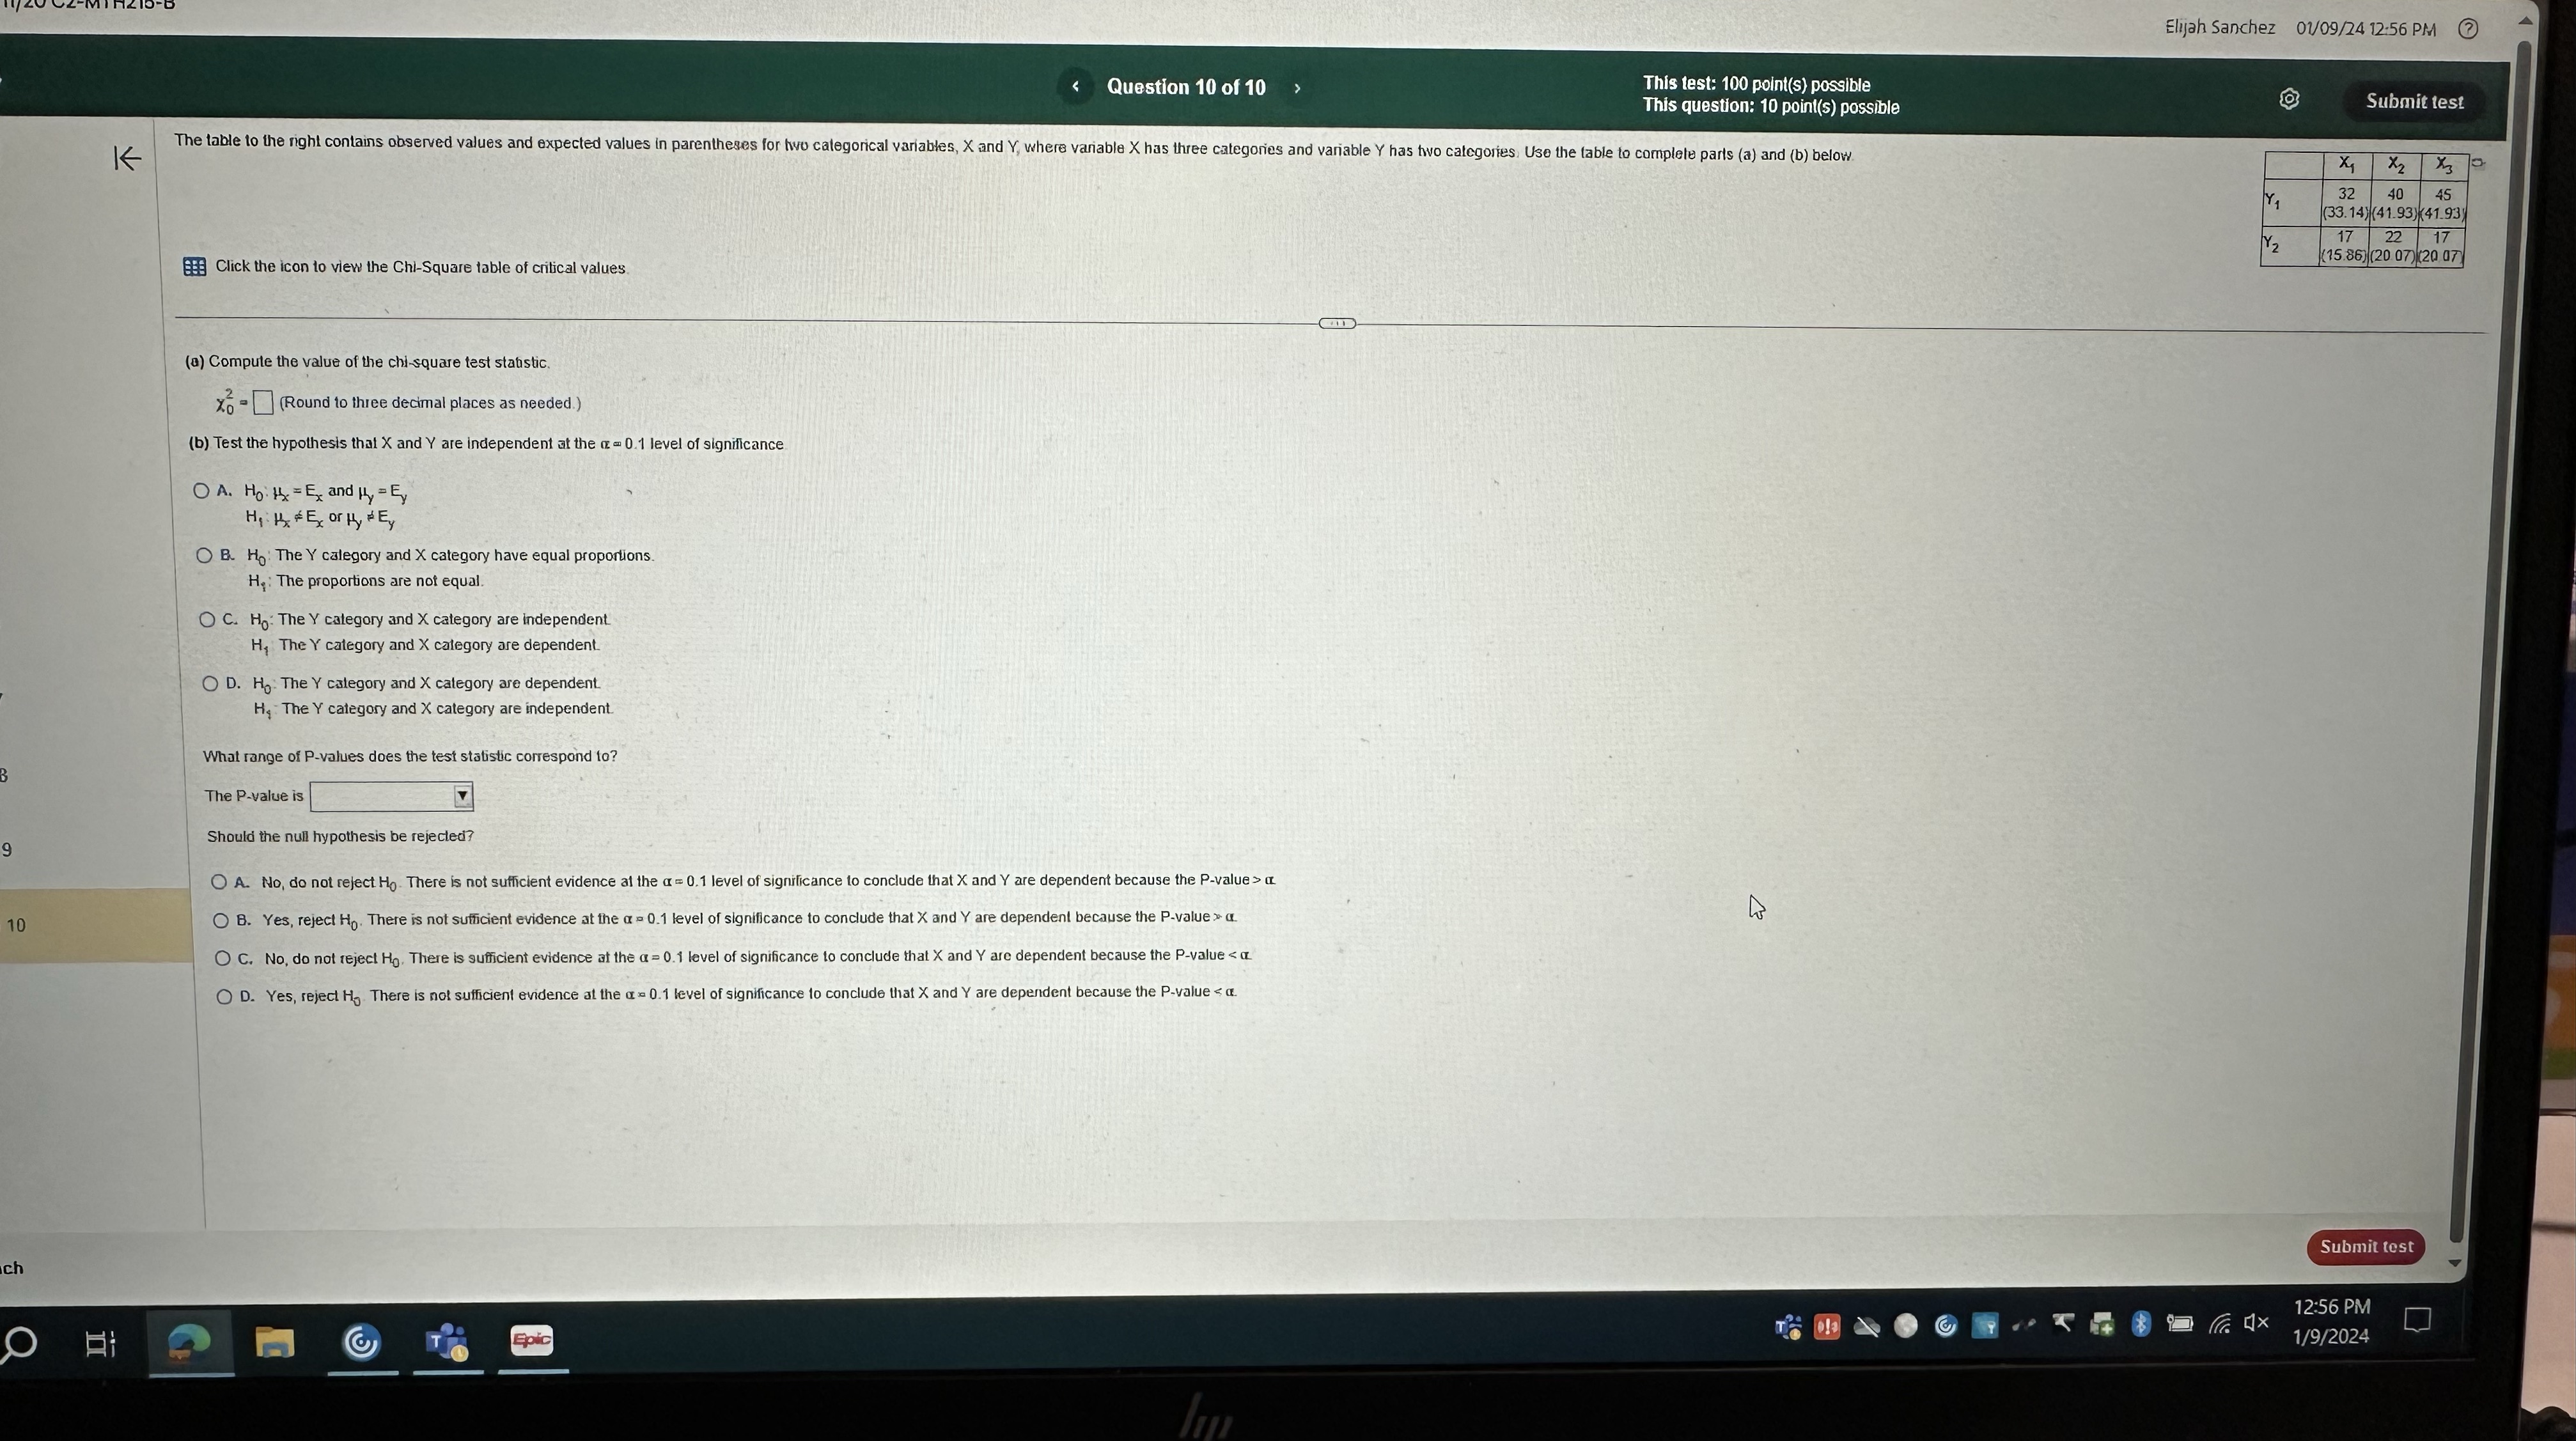
B 9 10 ch 0 III K < Question 10 of 10 > This test: 100 point(s) possible This question: 10 point(s) possible The table to the right contains observed values and expected values in parentheses for hvo categorical variables, X and Y, where variable X has three categoes and variable Y has two categories. Use the table to complete parts (a) and (b) below. Click the icon to view the Chi-Square table of critical values. (a) Compute the value of the chi-square test stabstic. % (Round to three decimal places as needed.) (b) Test the hypothesis that X and Y are independent at the 0.1 level of significance OA. Ho Ex and y = Ey H E or Hy Ey OB. Ho The Y calegory and X category have equal proportions. H: The proportions are not equal. OC. Ho: The Y category and X category are independent H, The Y category and X category are dependent. OD. Ho The Y category and X category are dependent. H, The Y category and X category are independent. What range of P-values does the test statistic correspond to? The P-value is Should the null hypothesis be rejected? OA. No, do not reject Ho. There is not sufficient evidence at the a=0.1 level of significance to conclude that X and Y are dependent because the P-value> a B. Yes, reject Ho. There is not sufficient evidence at the a- 0.1 level of significance to conclude that X and Y are dependent because the P-value> a OC. No, do not reject Ho. There is sufficient evidence at the a- 0.1 level of significance to conclude that X and Y are dependent because the P-value
Step by Step Solution
There are 3 Steps involved in it

Get step-by-step solutions from verified subject matter experts