

Question: b. A company is facing some quality control issues. To identify the problem, the quality control manager asked an operator to take 8 samples of
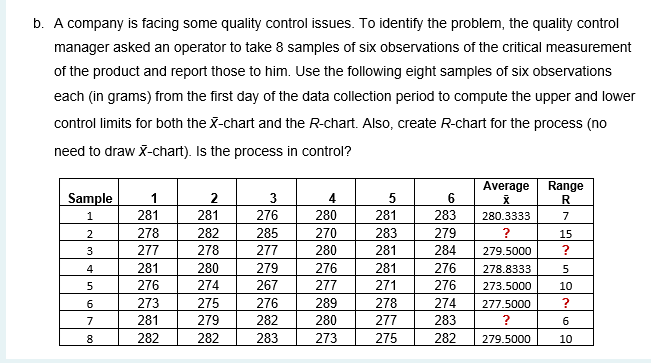
b. A company is facing some quality control issues. To identify the problem, the quality control manager asked an operator to take 8 samples of six observations of the critical measurement of the product and report those to him. Use the following eight samples of six observations each (in grams) from the first day of the data collection period to compute the upper and lower control limits for both the X-chart and the R-chart. Also, create R-chart for the process (no need to draw X-chart). Is the process in control? Sample 1 2 3 276 285 Range R 7 15 ? 3 277 1 281 278 277 281 276 273 281 282 2 281 282 278 280 274 275 279 282 4 Average X 280.3333 ? 279.5000 278.8333 273.5000 277.5000 4 280 270 280 276 277 289 280 273 6 283 279 284 276 276 274 283 5 281 283 281 281 271 278 277 275 5 279 267 276 282 283 5 10 ? 6 7 6 8 282 279.5000 10
Step by Step Solution
There are 3 Steps involved in it
1 Expert Approved Answer
Step: 1 Unlock

Question Has Been Solved by an Expert!
Get step-by-step solutions from verified subject matter experts
Step: 2 Unlock
Step: 3 Unlock