

Question: B. Based on your p-chart and the data in the table, what can you conclude about the waiting time of the patients? Use the p-chart
B. Based on your p-chart and the data in the table, what can you conclude about the waiting time of the patients?
Use the p-chart from part (a) to determine if the process is out of control. If any of the sample points fall outside of the control limits or if the chart shows any unusual patterns, such as a run or a sudden change, then the process it out of statistical control.
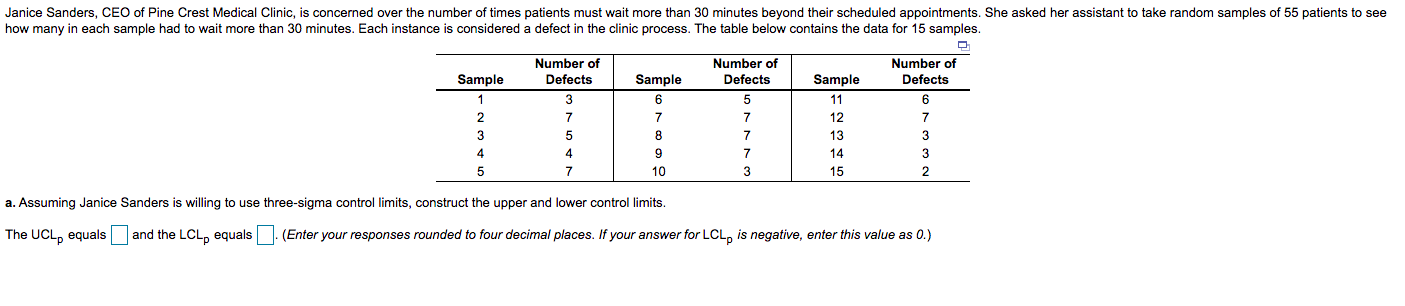
Janice Sanders, CEO of Pine Crest Medical Clinic, is concerned over the number of times patients must wait more than 30 minutes beyond their scheduled appointments. She asked her assistant to take random samples of 55 patients to see how many in each sample had to wait more than 30 minutes. Each instance is considered a defect in the clinic process. The table below contains the data for 15 samples. Number of Defects Number of Defects Sample 6 7 5 Number of Defects 3 7 5 4 7 Sample 1 2 3 4 5 Sample 11 12 13 14 15 7 7 7 3 8 9 10 6 7 3 3 2 a. Assuming Janice Sanders is willing to use three-sigma control limits, construct the upper and lower control limits. The UCLA equals and the LCLequals (Enter your responses rounded to four decimal places. If your answer for LCLis negative, enter this value as 0.)Step by Step Solution
There are 3 Steps involved in it
1 Expert Approved Answer
Step: 1 Unlock

Question Has Been Solved by an Expert!
Get step-by-step solutions from verified subject matter experts
Step: 2 Unlock
Step: 3 Unlock