

Question: OMIS 4 4 2 SPC Homework Assignment 2 Garcia's Garage desires to create some colorful charts and graphs to illustrate how reliably its mechanics get
OMIS SPC Homework Assignment
Garcia's Garage desires to create some colorful charts and graphs to illustrate how reliably its
mechanics "get under the hood and fix the problem". The historical average for the proportion
of customers that return for the same repair within the day warranty period is Each
month, Garcia tracks customers to see whether they return for warranty repairs. The
results are plotted as a proportion to report progress toward the goal. Determine the control
limits for this chart. In March, of the customers in the sample group returned for
warranty repairs. Is the repair process in control? points
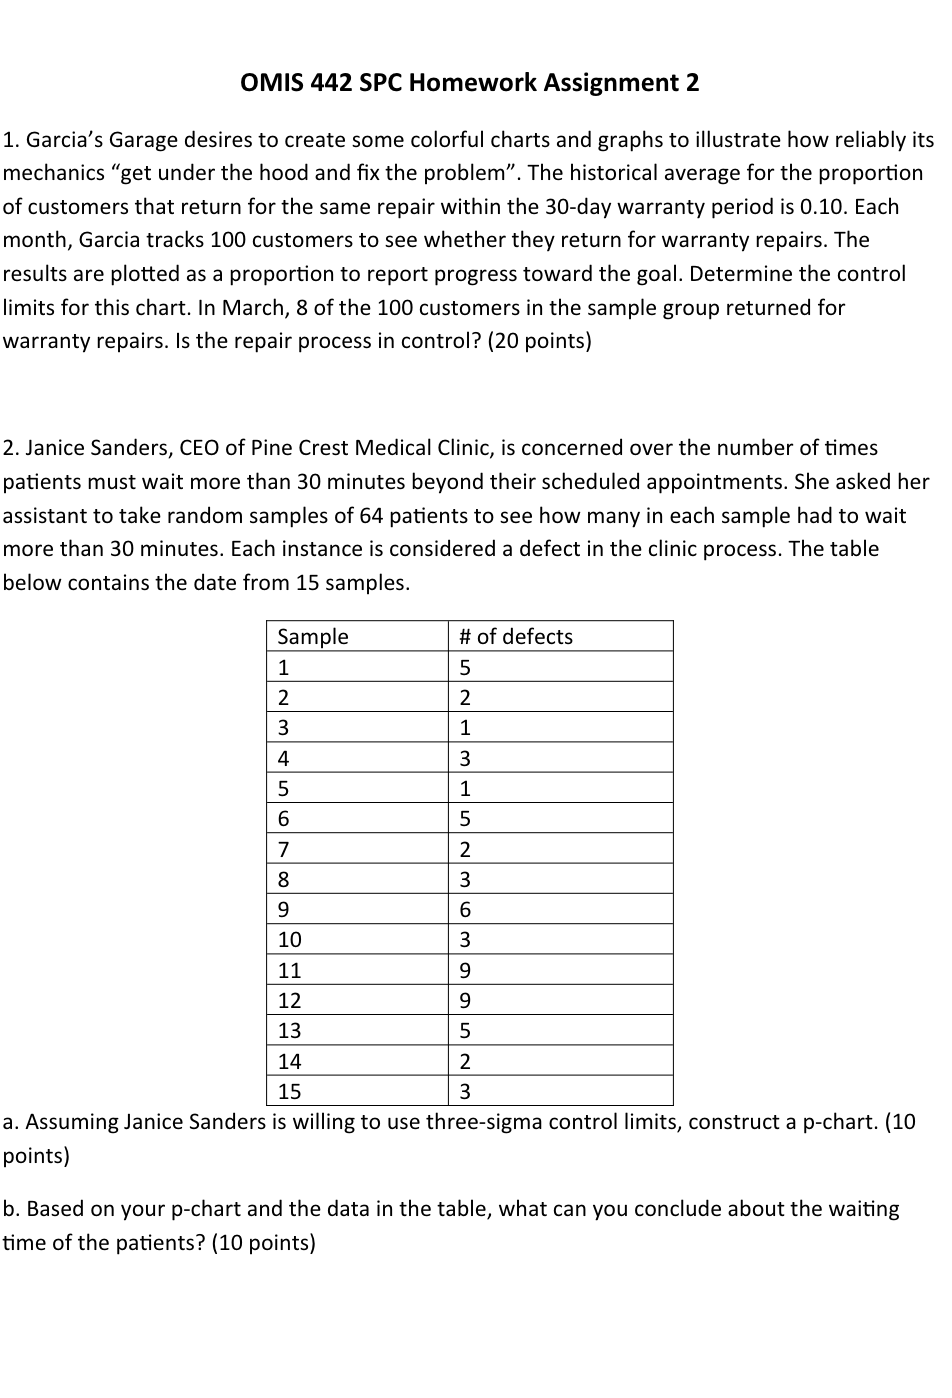
Janice Sanders, CEO of Pine Crest Medical Clinic, is concerned over the number of times
patients must wait more than minutes beyond their scheduled appointments. She asked her
assistant to take random samples of patients to see how many in each sample had to wait
more than minutes. Each instance is considered a defect in the clinic process. The table
below contains the date from samples.
a Assuming Janice Sanders is willing to use threesigma control limits construct a pchart.
points
b Based on your pchart and the data in the table, what can you conclude about the waiting
time of the patients? points
Step by Step Solution
There are 3 Steps involved in it
1 Expert Approved Answer
Step: 1 Unlock

Question Has Been Solved by an Expert!
Get step-by-step solutions from verified subject matter experts
Step: 2 Unlock
Step: 3 Unlock