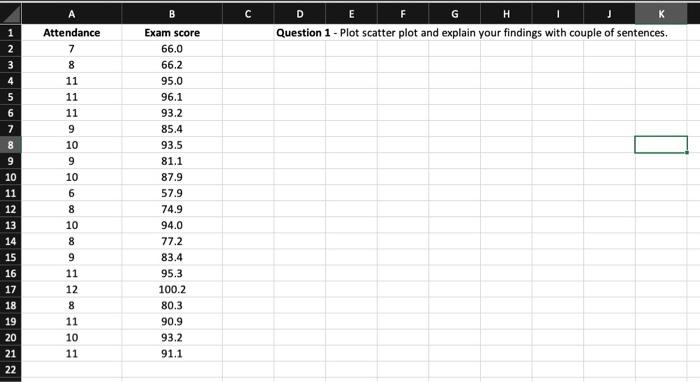
Question: B C D E F F G H Question 1 - Plot scatter plot and explain your findings with couple of sentences. 1 2 3

B C D E F F G H Question 1 - Plot scatter plot
B C D E F F G H Question 1 - Plot scatter plot and explain your findings with couple of sentences. 1 2 3 4 5 6 7 8 9 Attendance 7 8 11 11 11 9 10 9 10 6 8 10 10 11 12 13 14 15 16 17 18 19 20 21 22 Exam score 66.0 66.2 95.0 96.1 93.2 85.4 93.5 81.1 87.9 57.9 74.9 94.0 77.2 83.4 95.3 100.2 80.3 90.9 93.2 91.1 8 9 11 12 8 11 10 11 G H D E F Question 2 - Plot histogram for exam scores. w N A 1 2 3 Attendance 7 8 00 4 11 un 6 11 11 9 10 9 10 8 B Exam score 66.0 66.2 95.0 96.1 93.2 85.4 93.5 81.1 87.9 57.9 74.9 94.0 77.2 83.4 95.3 100.2 80.3 90.9 93.2 91.1 5 6 7 8 9 10 11 12 13 14 15 16 17 18 19 20 21 22 As a sa 6 8 9 8 9 8 10 11 12 11 10 11 Open recovered books? Your recent changes were saved. Do you want to continue working where you let off? D E F G H Question 3 - Plot pareto chart, and explain your finding briefly. N Mistakes in the exam Question 1 Process Flow Question 1 Gantt Chart Question 2 Process Strategy Question 3 Network Diagram Question 3 Probability B Number of errors 10 50 35 5 15 9 10 11

Step by Step Solution

There are 3 Steps involved in it

1 Expert Approved Answer
Step: 1 Unlock blur-text-image
Question Has Been Solved by an Expert!

Get step-by-step solutions from verified subject matter experts

Step: 2 Unlock
Step: 3 Unlock

Students Have Also Explored These Related General Management Questions!