

Question: B C D E F G H Chapter 8. Risk and Rates of Return This spreadsheet model is designed to be used in conjunction with
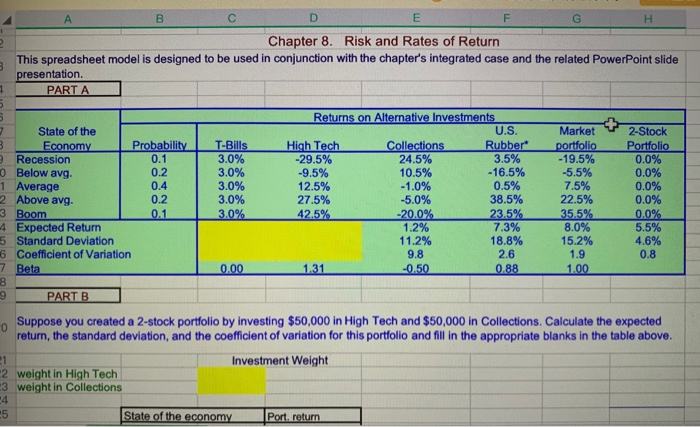
B C D E F G H Chapter 8. Risk and Rates of Return This spreadsheet model is designed to be used in conjunction with the chapter's integrated case and the related PowerPoint slide presentation. PARTA 2 State of the Economy Probability Recession 0 Below avg. 1 Average 2 Above avg. 3 Boom 4 Expected Return 5 Standard Deviation 6 Coefficient of Variation 7 Beta T-Bills 3.0% 3.0% 3.0% 3.0% 3.0% Returns on Alternative Investments U.S. High Tech Collections Rubber -29.5% 24.5% 3.5% -9.5% 10.5% -16.5% 12.5% -1.0% 0.5% 27.5% -5.0% 38.5% 42.5% -20.0% 23.5% 1.2% 7.3% 11.2% 18.8% 9.8 2.6 1.31 -0.50 0.88 Market T portfolio -19.5% -5.5% 7.5% 22.5% 35.5% 8.0% 15.2% 2-Stock Portfolio 0.0% 0.0% 0.0% 0.0% 0.0% 5.5% 4.6% 1.9 0.8 0.00 1.00 9 PART B Suppose you created a 2-stock portfolio by investing $50,000 in High Tech and $50,000 in Collections. Calculate the expected return, the standard deviation, and the coefficient of variation for this portfolio and fill in the appropriate blanks in the table above. Investment Weight 2 weight in High Tech 3 weight in Collections State of the economy Port, return
Step by Step Solution
There are 3 Steps involved in it

Get step-by-step solutions from verified subject matter experts