

Question: B C D E F G H Chapter 8. Risk and Rates of Return This spreadsheet model is designed to be used in conjunction with
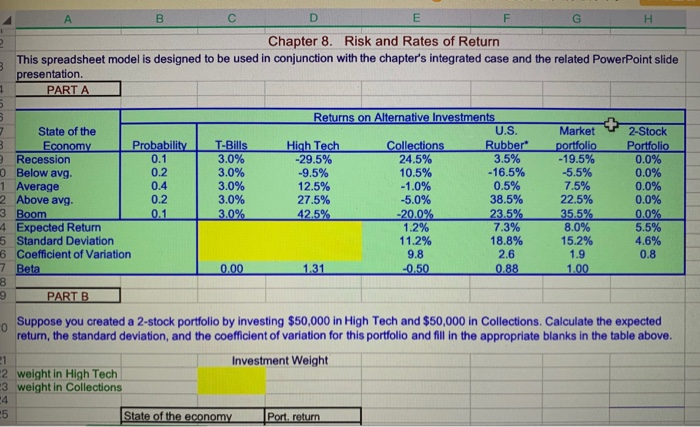
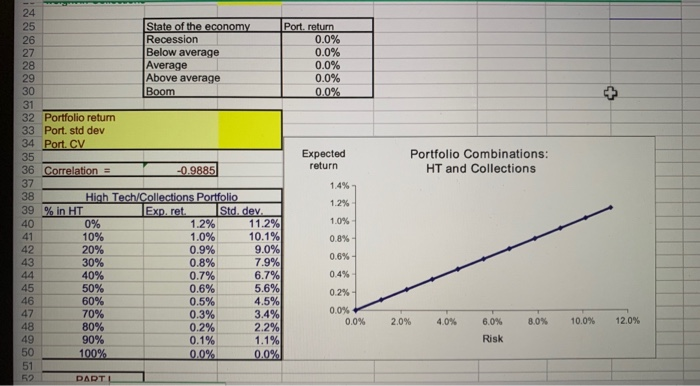
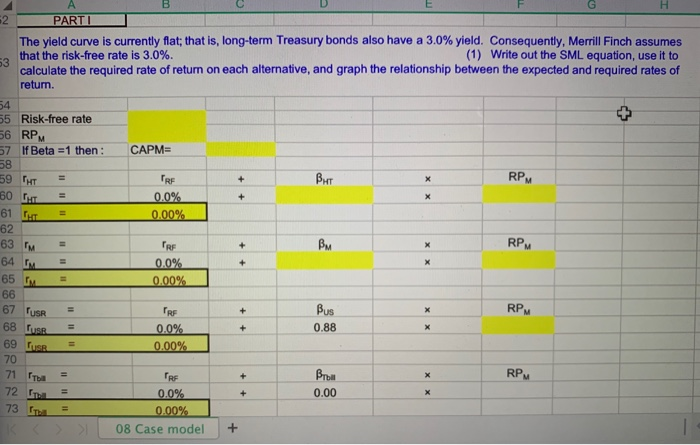
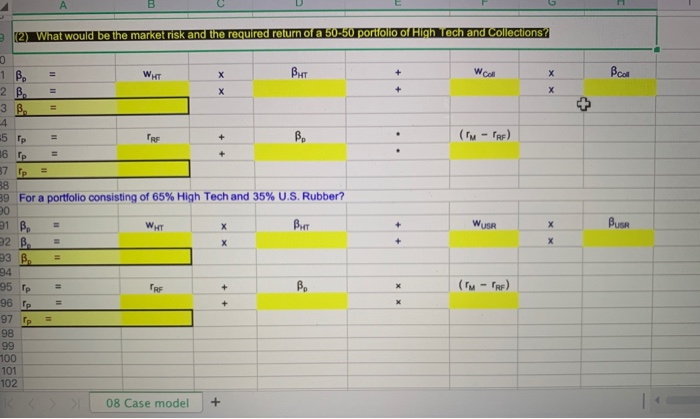
B C D E F G H Chapter 8. Risk and Rates of Return This spreadsheet model is designed to be used in conjunction with the chapter's integrated case and the related PowerPoint slide presentation. PARTA 2 State of the Economy Probability Recession 0 Below avg. 1 Average 2 Above avg. 3 Boom 4 Expected Return 5 Standard Deviation 6 Coefficient of Variation 7 Beta T-Bills 3.0% 3.0% 3.0% 3.0% 3.0% Returns on Alternative Investments U.S. High Tech Collections Rubber -29.5% 24.5% 3.5% -9.5% 10.5% -16.5% 12.5% -1.0% 0.5% 27.5% -5.0% 38.5% 42.5% -20.0% 23.5% 1.2% 7.3% 11.2% 18.8% 9.8 2.6 1.31 -0.50 0.88 Market T portfolio -19.5% -5.5% 7.5% 22.5% 35.5% 8.0% 15.2% 2-Stock Portfolio 0.0% 0.0% 0.0% 0.0% 0.0% 5.5% 4.6% 1.9 0.8 0.00 1.00 9 PART B Suppose you created a 2-stock portfolio by investing $50,000 in High Tech and $50,000 in Collections. Calculate the expected return, the standard deviation, and the coefficient of variation for this portfolio and fill in the appropriate blanks in the table above. Investment Weight 2 weight in High Tech 3 weight in Collections State of the economy Port, return State of the economy Recession Below average Average Above average Boom Port, return 0.0% 0.0% 0.0% 0.0% 0.0% Portfolio return Port. std dev 34 Port. CV Expected return Portfolio Combinations: HT and Collections Correlation = -0.9885 0% High Tech/Collections Portfolio % in HT Exp. ret. Std. dev. 1.2% 11.2% 10% 1.0% 10.1% 20% 0.9% 9.0% 30% 0.8% 7.9% 40% 0.7% 6.7% 50% 0.6% 5.6% 60% 0.5% 4.5% 70% 0.3% 3.4% 80% 0.2% 2.2% 90% 0.1% 1.1% 100% 0.0% 0.0% 1.2% 1.0% 0.8% 0.6% 0.4% 0.2% 0.0% 0.0% 20% 40% 8.0% 0.0% 12.0% 6.0% Risk DARTL 2 G H PARTI The yield curve is currently flat; that is, long-term Treasury bonds also have a 3.0% yield. Consequently, Merrill Finch assumes that the risk-free rate is 3.0%. (1) Write out the SML equation, use it to calculate the required rate of return on each alternative, and graph the relationship between the expected and required rates of return. 55 Risk-free rate 56 RPM 57 If Beta =1 then: CAPM= = = = CRF 0.0% 0.00% = = = FRE 0.0% 0.00% 59 THT 60 61 HT 62 63 M 64 65 66 67 TUS 68 LSR 69 LSR 70 71 Too 72 m 73 K S PRE Bus = = = 0.88 0.0% 0.00% = = = 0.00 PRE 0.0% 0.00% 108 Case model What would be the market risk and the required return of a 50-50 portiollo of Hightech and Collections w Bu Wall 1 B B = = ( u - ra) 19 For a portfolio consisting of 65% High Tech and 35% U.S. Rubber? 00 wer But 31 B 32 B 23 B = = = 95 p = 96 te 98 100 101 102 08 Case model +
Step by Step Solution
There are 3 Steps involved in it

Get step-by-step solutions from verified subject matter experts