Question: B C D E F G H J L M N 1 YEAR ACTUAL SALES 2 YR MOVING AVG ERROR ABS DEVIATION MAD 4 YR
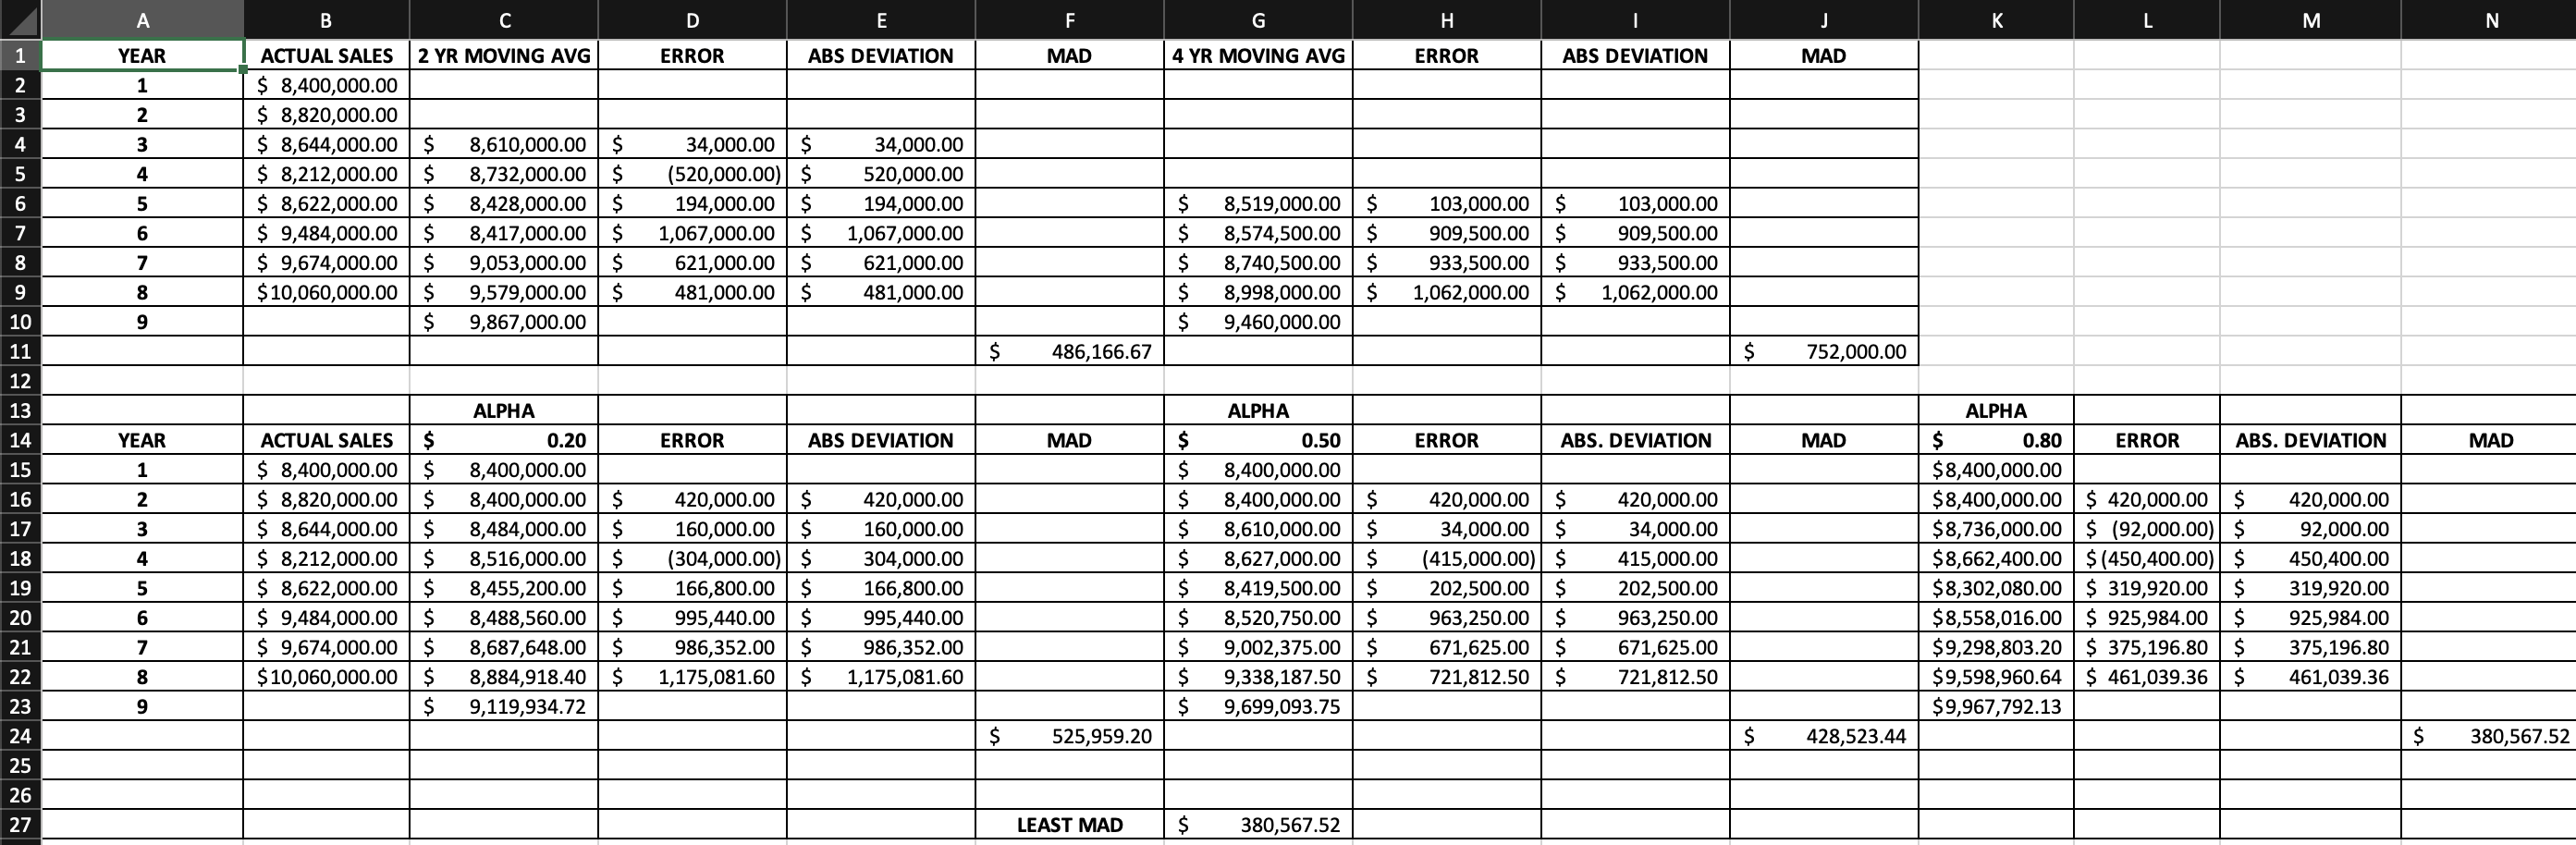
B C D E F G H J L M N 1 YEAR ACTUAL SALES 2 YR MOVING AVG ERROR ABS DEVIATION MAD 4 YR MOVING AVG ERROR ABS DEVIATION MAD 2 1 3 2 4 3 5 4 $ 8,400,000.00 $ 8,820,000.00 $ 8,644,000.00 $ 8,212,000.00 $ 8,622,000.00 $ 9,484,000.00 $ 9,674,000.00 $ 10,060,000.00 6 5 103,000.00 $ $ $ $ $ $ $ 34,000.00 $ (520,000.00) $ 194,000.00 $ 1,067,000.00 $ 621,000.00 $ 481,000.00 $ 7 8,610,000.00 $ 8,732,000.00 $ 8,428,000.00 $ 8,417,000.00 $ 9,053,000.00 $ 9,579,000.00 $ 9,867,000.00 34,000.00 520,000.00 194,000.00 1,067,000.00 621,000.00 481,000.00 6 103,000.00 $ 909,500.00 $ 933,500.00 $ 1,062,000.00 $ 8 sleslenlerle 8,519,000.00 $ $ 8,574,500.00 $ $ 8,740,500.00 $ 8,998,000.00 $ 9,460,000.00 909,500.00 933,500.00 7 9 8 1,062,000.00 10 9 11 $ 486,166.67 $ 752,000.00 12 13 ALPHA ALPHA ALPHA 14 YEAR 0.20 ERROR ABS DEVIATION MAD 0.50 ERROR ABS. DEVIATION MAD 0.80 ERROR ABS. DEVIATION MAD 15 1 16 2 17 3 18 4 ACTUAL SALES $ $ 8,400,000.00 $ $ 8,820,000.00 $ $ 8,644,000.00 $ $ 8,212,000.00 $ $ 8,622,000.00 $ $ 9,484,000.00 $ $ 9,674,000.00 $ $ 10,060,000.00 $ $ 19 8,400,000.00 8,400,000.00 $ 8,484,000.00 $ 8,516,000.00 $ 8,455,200.00 $ 8,488,560.00 $ 8,687,648.00 $ 8,884,918.40 $ 9,119,934.72 5 $ $ $ $ $ $ $ $ $ $ 420,000.00 $ 160,000.00 $ (304,000.00) $ 166,800.00 $ 995,440.00 $ 986,352.00 $ 1,175,081.60 $ 420,000.00 160,000.00 304,000.00 166,800.00 995,440.00 986,352.00 1,175,081.60 8,400,000.00 8,400,000.00 $ 8,610,000.00 $ 8,627,000.00 $ 8,419,500.00 $ 8,520,750.00 $ 9,002,375.00 $ 9,338,187.50 $ 9,699,093.75 420,000.00 $ 34,000.00 $ (415,000.00) $ 202,500.00 $ 963,250.00 $ 671,625.00 $ 721,812.50 $ 420,000.00 34,000.00 415,000.00 202,500.00 963,250.00 671,625.00 721,812.50 $8,400,000.00 $8,400,000.00 $ 420,000.00 $ $8,736,000.00 $ (92,000.00) $ $8,662,400.00 $ (450,400.00) $ $8,302,080.00 $ 319,920.00 $ $8,558,016.00 $ 925,984.00 $ $9,298,803.20 $ 375,196.80 $ $9,598,960.64 $ 461,039.36 $9,967,792.13 420,000.00 92,000.00 450,400.00 319,920.00 925,984.00 375,196.80 461,039.36 20 6 21 7 22 8 23 9 24 $ 525,959.20 $ 428,523.44 $ 380,567.52 25 26 27 LEAST MAD 380,567.52 Enrichment Suppose Ahmed uses a regression analysis of the data for the next year's sales forecast. 1. Show a graph of the regression analysis and indicate the relationship between variables. 2. Compute the coefficient of correlation. 3. What is the next year's sales forecast? 4. Is this prediction worse than, equal to, or better than your prior recommendation(s)


