

Question: B C E G Rent Use a cell reference or a single formula where appropriate in order to receive full credit. Do not copy and
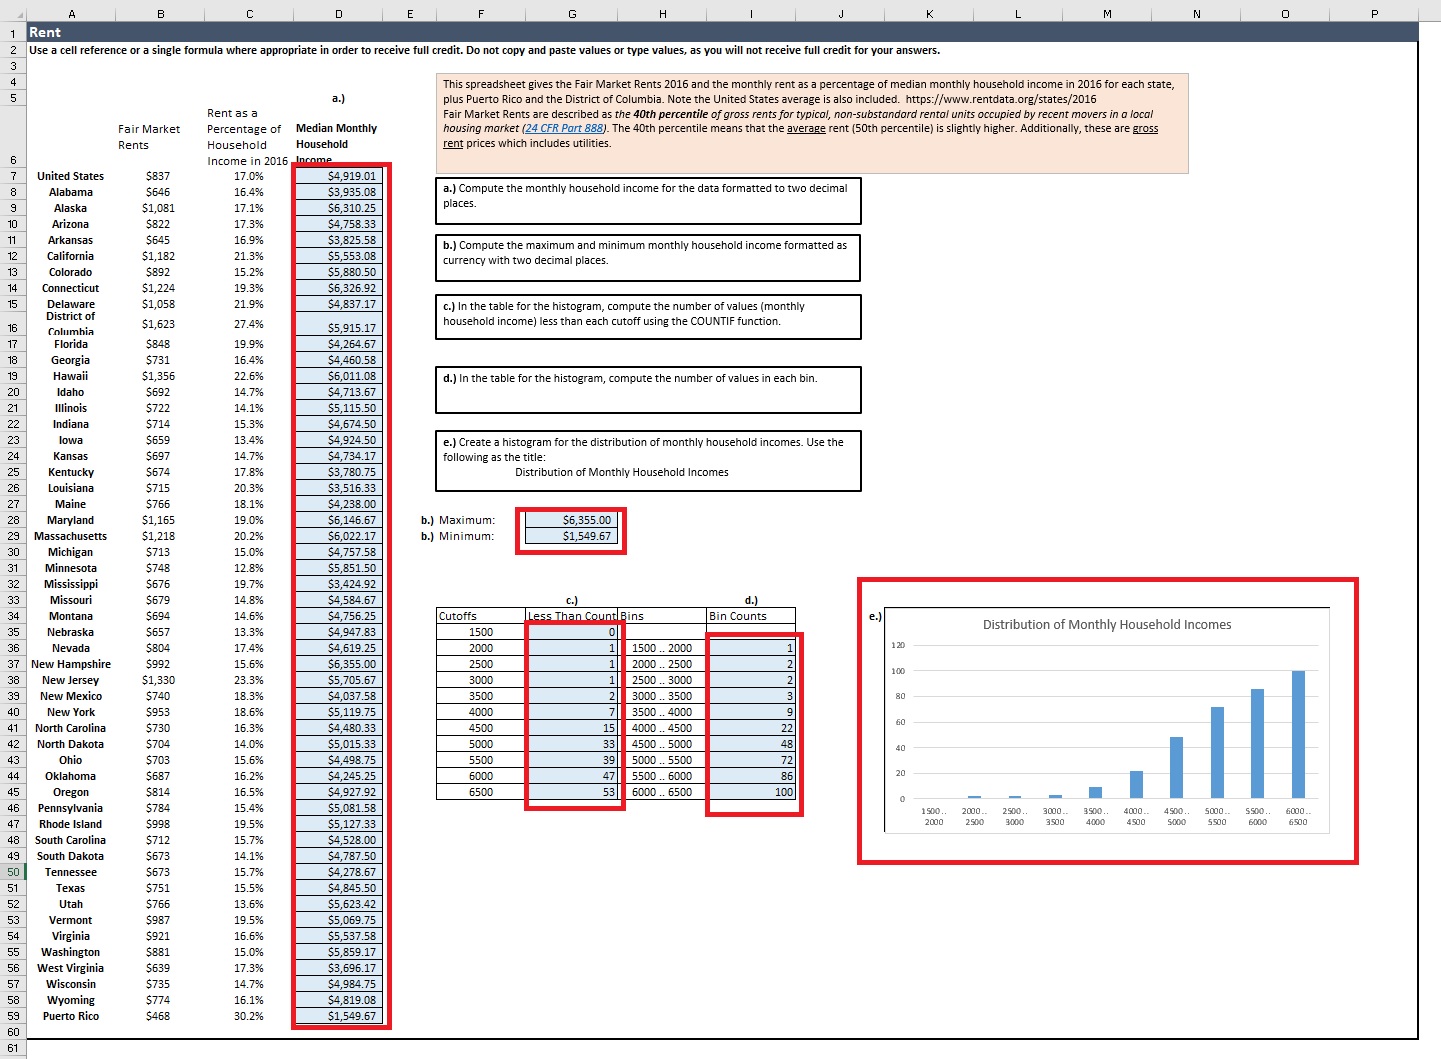
B C E G Rent Use a cell reference or a single formula where appropriate in order to receive full credit. Do not copy and paste values or type values, as you will not receive full credit for your answers. This spreadsheet gives the Fair Market Rents 2016 and the monthly rent as a percentage of median monthly household income in 2016 for each state, plus Puerto Rico and the District of Columbia. Note the United States average is also included. https://www.rentdata.org/states/2016 Rent as a Fair Market Rents are described as the 40th percentile of gross rents for typical, non-substandard rental units occupied by recent movers in a local Fair Market Percentage of Median Monthly housing market (24 CFR Part 888). The 40th percentile means that the average rent (50th percentile) is slightly higher. Additionally, these are gross Rents Household Household rent prices which includes utilities. Income in 2016 Income United States $837 17.0% $4,919.01 $646 16.4% $3,935.08 .) Compute the monthly household income for the data formatted to two decimal Alaska 17.1% $6,310.25 places Arizona $822 17.3% $4,758.33 Arkansas $645 16.9% $3,825.58 .) Compute the maximum and minimum monthly household income formatted as California $1,18 21.39 Colorado $892 15.2% $5,880.50 currency with two decimal places Connecticut $1,224 19.3% $6,326.92 Delaware $1,058 21.9 $4,837.17 c.) In the table for the histogram, compute the number of values (monthly District of Columbia $1,62 27.4% $5,915.17 household income) less than each cutoff using the COUNTIF function. Florida $848 19.9% $4,264.67 18 Georgia $731 16.4% $4,460.58 19 $1,35 22.6% $6,011.08 d.) In the table for the histogram, compute the number of values in each bin. 20 $692 14.7% $4,713.67 21 $722 14.1% 22 15.3% $4,674.50 23 13.4% $4,924.50 e.) Create a histogram for the distribution of monthly household incomes. Use the 24 $697 14.79 following as the title: 25 Kentucky $674 17.8% $3,780.75 Distribution of Monthly Household Incomes 26 Louisiana $715 20.3% $3,516.33 27 $766 18.1% $4,238.00 28 Maryland 19.0% $6,146.67 b.) Maximum: $6,355.00 29 Massachusetts $1,21 20.2% $6,022.17 b.) Minimum $1,549.67 30 Michigan $713 15.0% $4,757.58 Minnesota $748 12.8% Mississippi $676 19.7% $679 14.8% $4,584.67 Montana 14.6% Cutoffs Less Than Count Bins Bin Counts e . ) 35 Nebraska $657 13.3% $4,947.83 1500 Distribution of Monthly Household Incomes 36 Nevada $804 17.4% $4,619.25 2000 1500 .. 2000 120 37 New Hampshire $992 15.6% 56,355.00 2500 2000 .. 2500 100 38 New Jersey 23.3% $5,705.67 3000 2500 .. 3000 39 New Mexic $740 18.3% $4,037.58 3500 3000 .. 3500 80 40 New York $953 18.6% 4000 60 41 North Carolina $730 16.3% $4,480.33 4500 15 4000 .. 4500 42 North Dakota 14.0% $5,015.33 5000 33 4500 .. 5000 48 40 43 Ohio 15.6% 5500 39 5000 .. 5500 44 Oklahoma 16.29 6000 5500 .. 6000 86 45 Oregon $814 16.5% 6500 53 100 46 Pennsylvania $784 15.49 $5,081.58 2000 2500. 3000 3500. 4000 .. 4500 .. 5000 .. 5500. 6000 3090 3930 5500 6500 47 Rhode Island $998 19.5% $5,127.33 2000 2500 4000 4500 5000 6000 48 South Carolin $712 15.7% $4,528.00 49 South Dakota $673 14.1% $4,787.50 50 Tennessee $673 15.7% $4,278.67 51 Texas $751 15.5% $4,845.50 Utah 13.6% $5,623.42 Vermont $987 19.5% 16.6% 55 Washington 15.0% $5,859.17 56 West Virginia $639 17.3% $3,696.17 57 Wisconsin $735 14.7% 58 Wyoming $774 16.1% $4,819.08 59 Puerto Rico $468 30.2% $1,549.67 60
Step by Step Solution
There are 3 Steps involved in it

Get step-by-step solutions from verified subject matter experts