

Question: b) Calculate the correlation coefficient for the data. You can use the table to help you. Do this by hand using the equation and methodology
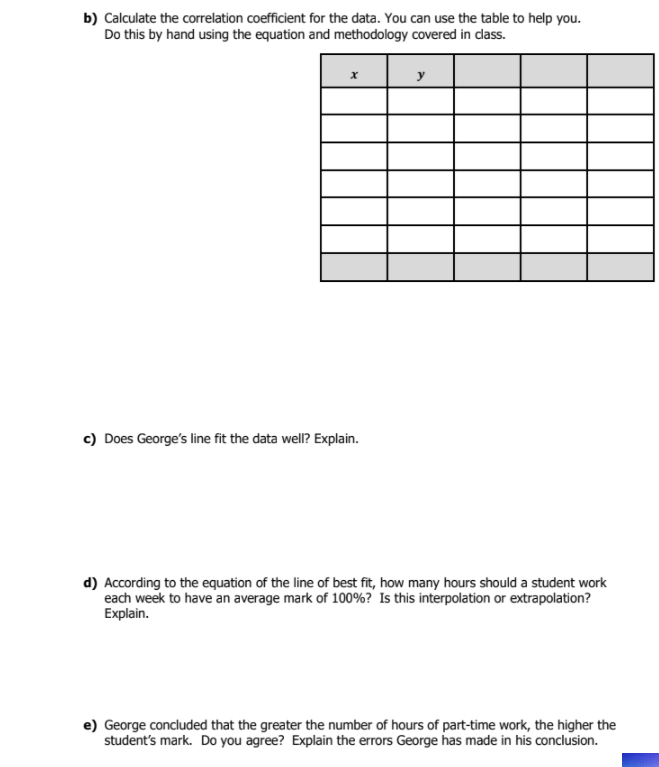


b) Calculate the correlation coefficient for the data. You can use the table to help you. Do this by hand using the equation and methodology covered in class. c) Does George's line fit the data well? Explain. d) According to the equation of the line of best fit, how many hours should a student work each week to have an average mark of 100%? Is this interpolation or extrapolation? Explain. e) George concluded that the greater the number of hours of part-time work, the higher the student's mark. Do you agree? Explain the errors George has made in his conclusion.1. George conducts a study of the relationship between the average number of hours a student works at a part-time job each week and their average mark. He collects data from a random sample of 5 students. The data is shown below: Hours Worked 3 8 5 10 15 Average Mark (%) 60 80 49 78 90 George plots the data on a scatter plot and notes there is a positive correlation. He calculates the line of best fit as y = 3x + 46, where x is the number of hours worked and y is the average mark. George concludes that his line of best fit is accurate and fits the data well. a) Draw a scatter plot of the data (by hand). Draw George's line on the same grid
Step by Step Solution
There are 3 Steps involved in it

Get step-by-step solutions from verified subject matter experts