

Question: (b) Complete the table and find the standard deviation. (up to four decimal places) Percent of Number of frequency Underweight Midpoint Deviation Deviation Countries x
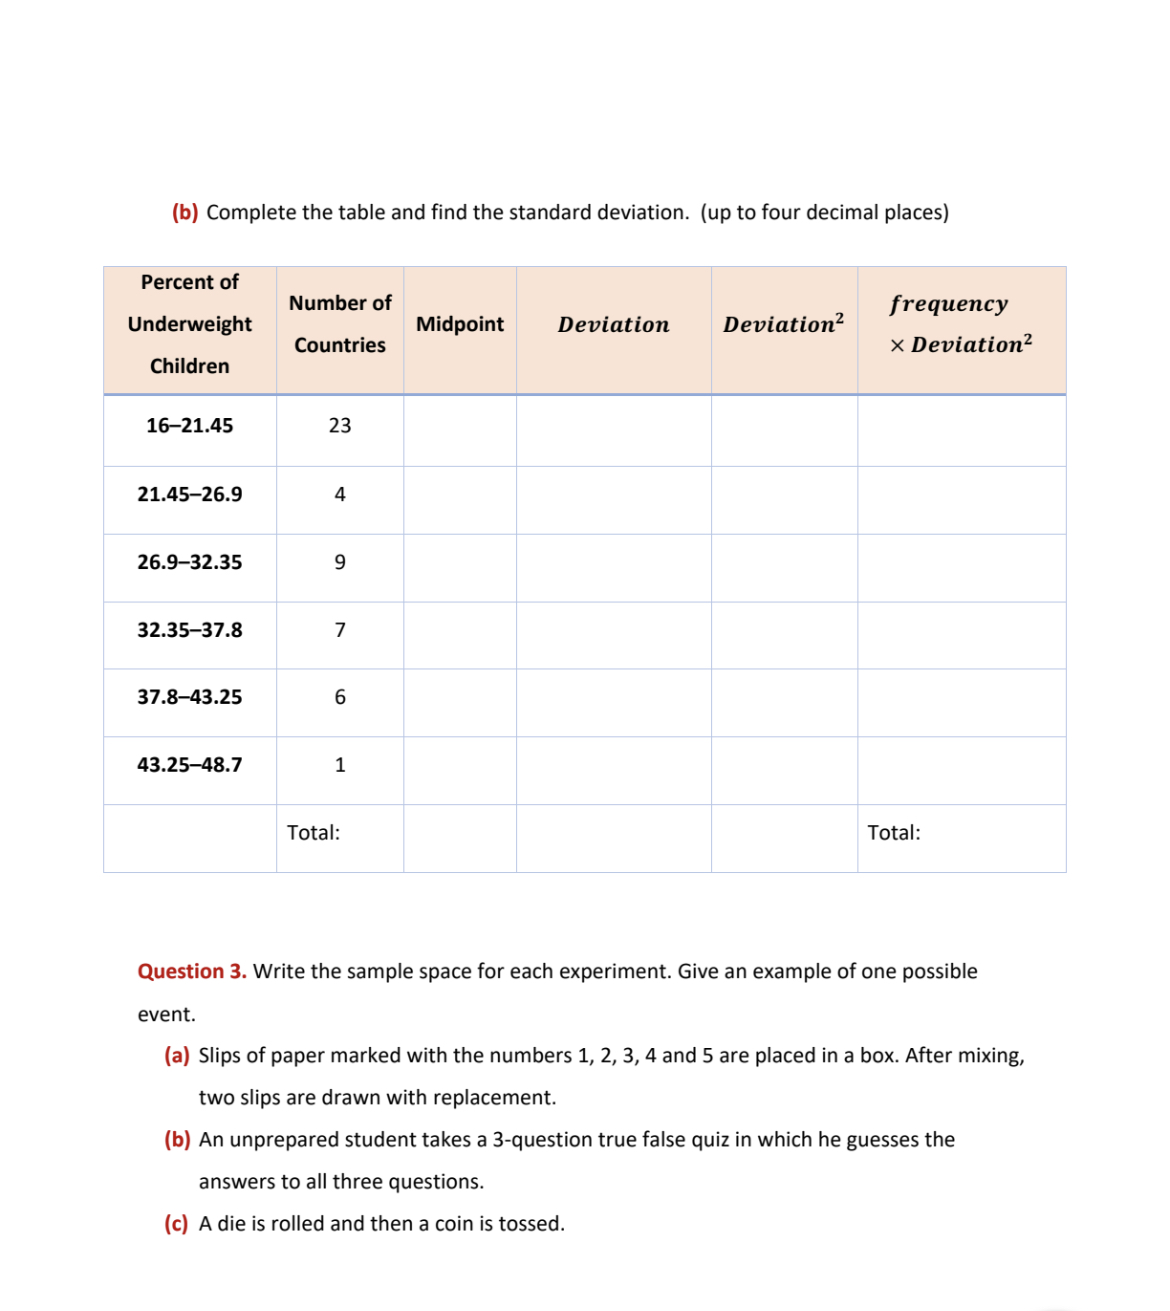
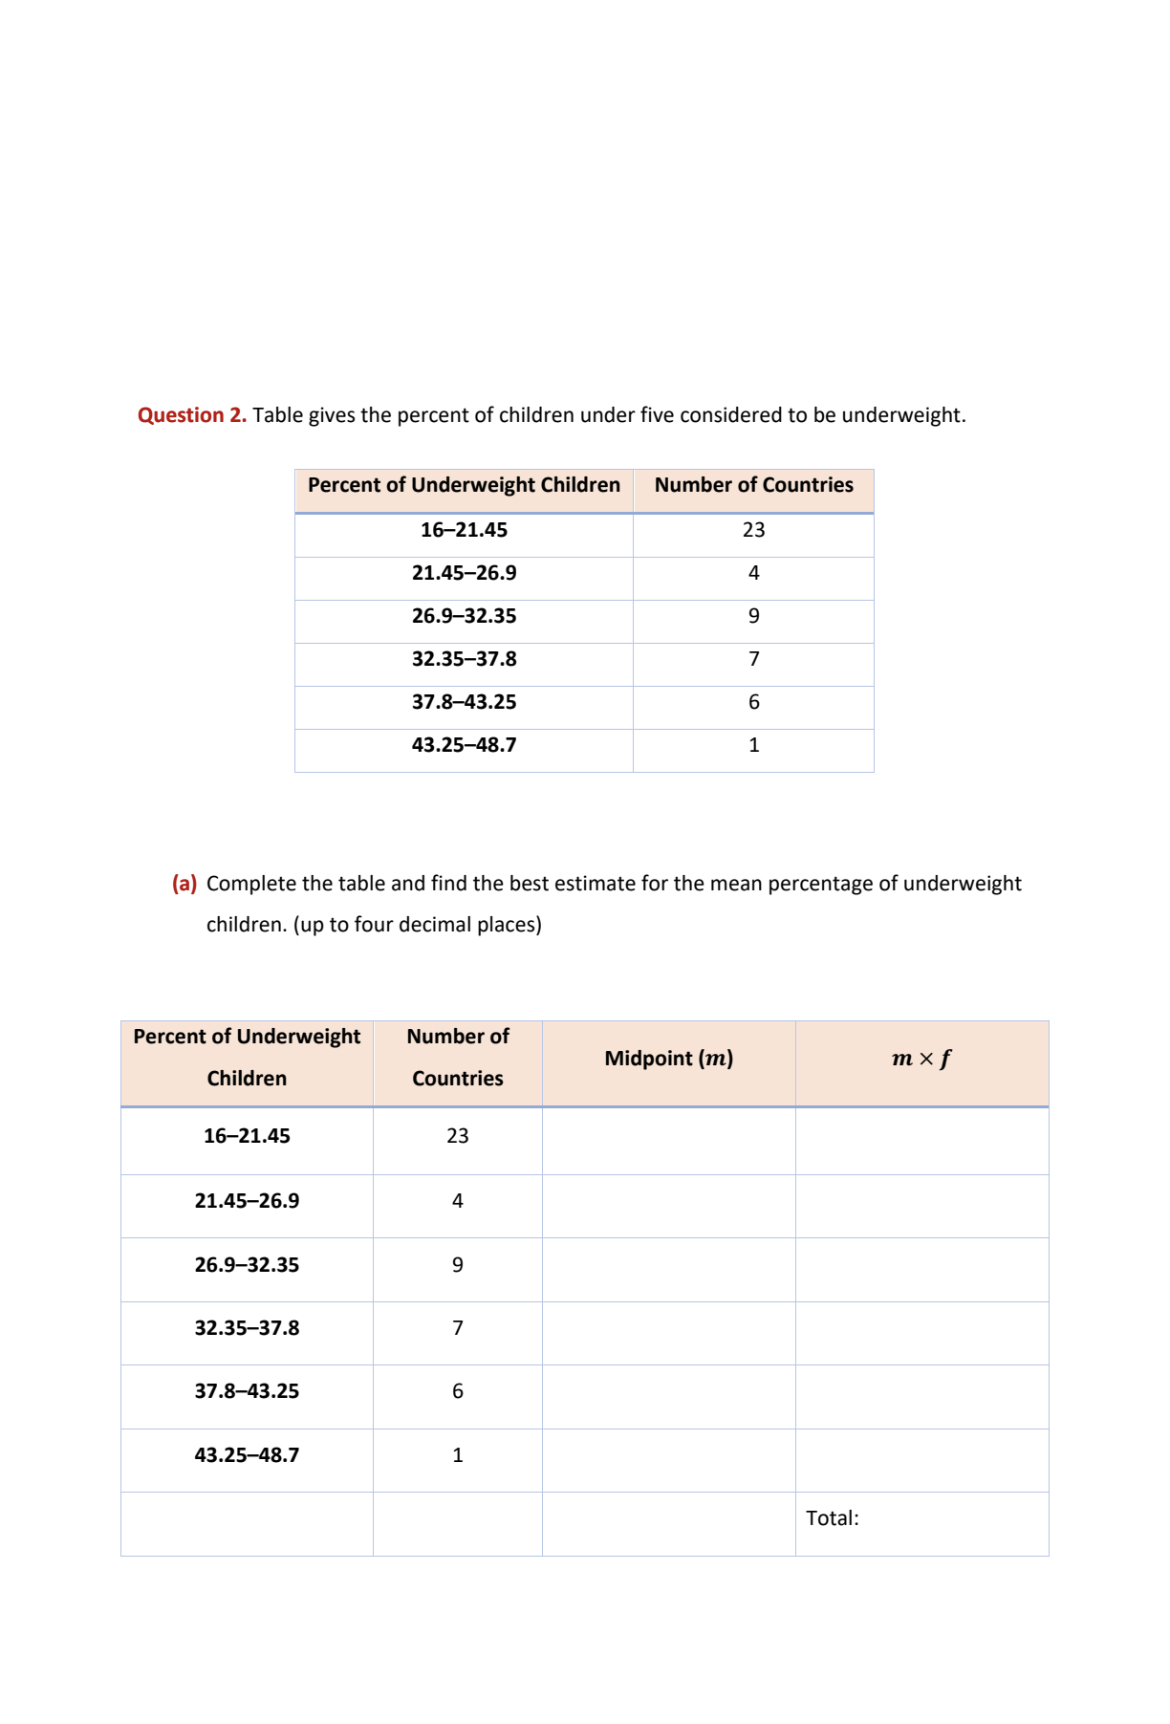
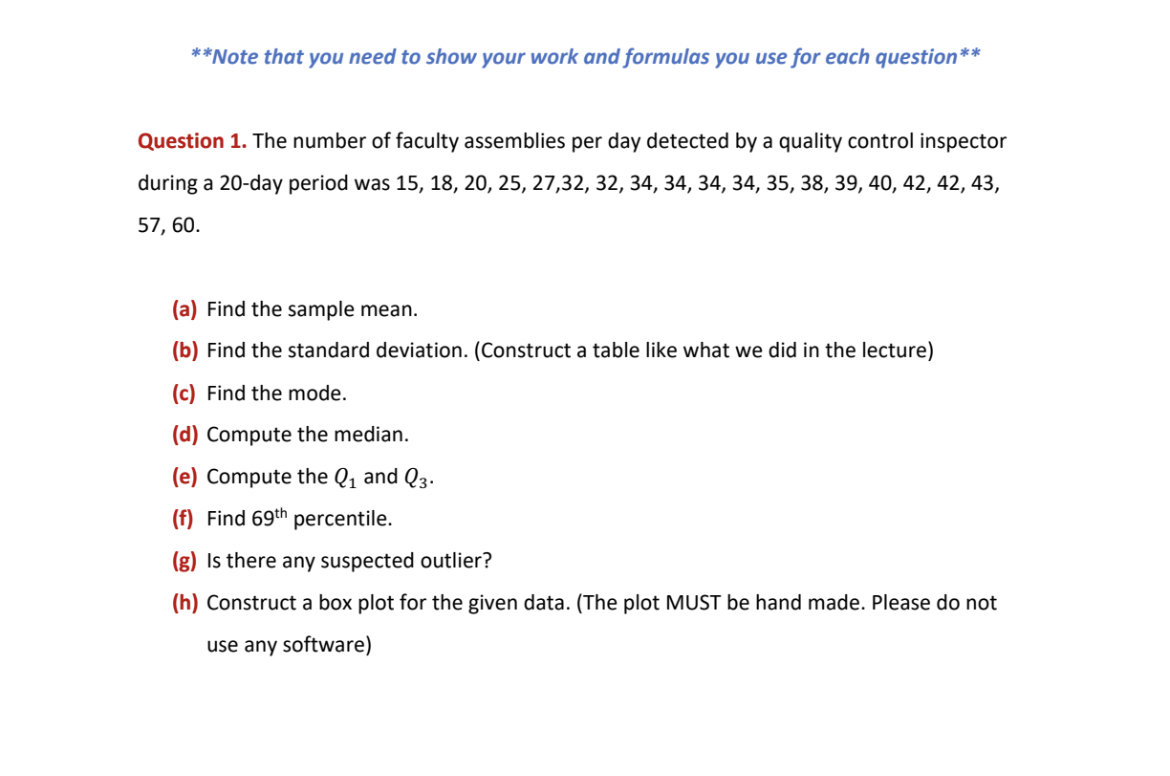
(b) Complete the table and find the standard deviation. (up to four decimal places) Percent of Number of frequency Underweight Midpoint Deviation Deviation Countries x Deviation Children 16-21.45 23 21.45-26.9 26.9-32.35 9 32.35-37.8 37.8-43.25 43.25-48.7 Total: Total: Question 3. Write the sample space for each experiment. Give an example of one possible event. (a) Slips of paper marked with the numbers 1, 2, 3, 4 and 5 are placed in a box. After mixing, two slips are drawn with replacement. (b) An unprepared student takes a 3-question true false quiz in which he guesses the answers to all three questions. (c) A die is rolled and then a coin is tossed.Question 2. Table gives the percent of children under five considered to be undemeight. Percent of Underweight Children I Number of Countries I 15-2145 23 21.45-26.33 ' 4 26.932.35 9 32.35-37.14 7 37.3-43.25 6 4325-48.? 1 (a) Complete the table and nd the best estimate for the mean percentage of underweight children. (up to four decimal places) Percent of Underweight Number of Children Countries Midpoint (m) m x f 16-2145 23 21.45-26.9 I 4 26.9-32.35 I 9 3235313 7 31.8-43.25 6 432543.? 1 Total: "Note that you need to show your work and formulas you use for each question" Question 1. The number of faculty assemblies per day detected by a quality control inspector during a 20-day period was 15, 18, 2o, 25, 27,32, 32, 34, 34, 34, 34, 35, 3s, 39, 4o, 42, 42, 43, 57, 60. (a) Find the sample mean. (b) Find the standard deviation. (Construct a table like what we did in the lecture) (c) Find the mode. (d) Compute the median. (e) Compute the 01 and Q3. (f) Find 69\"1 percentile. (3) Is there any suspected outlier? (h) Construct a box plot for the given data. (The plot MUST be hand made. Please do not use any software)
Step by Step Solution
There are 3 Steps involved in it

Get step-by-step solutions from verified subject matter experts