

Question: B) Compute the following ratios for 2010: C) Compare with industry norms and comment. Ratios Industry Norm 1. Working Capital N/A 2. Current Ratio 2.2
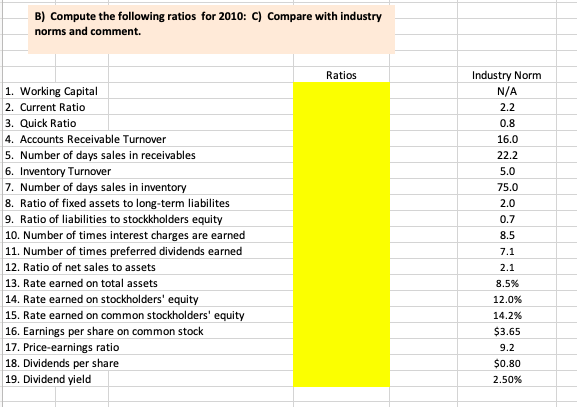
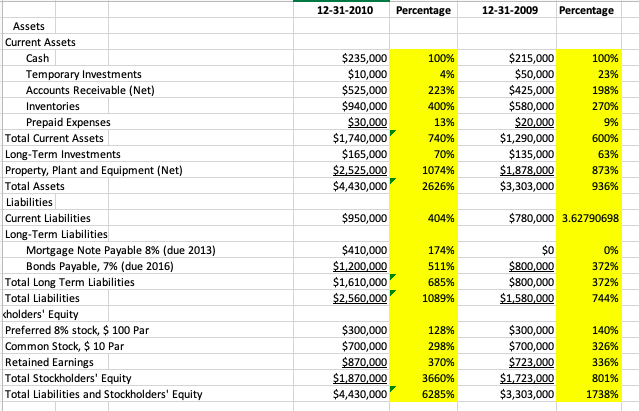
B) Compute the following ratios for 2010: C) Compare with industry norms and comment. Ratios Industry Norm 1. Working Capital N/A 2. Current Ratio 2.2 3. Quick Ratio 8'0 4. Accounts Receivable Turnover 16.0 5. Number of days sales in receivables 22.2 6. Inventory Turnover 5.0 7. Number of days sales in inventory 75.0 8. Ratio of fixed assets to long-term liabilitys 2.0 9. Ratio of liabilities to stockkholders equity 0.7 10. Number of times interest charges are earned 8.5 11. Number of times preferred dividends earned 7.1 12. Ratio of net sales to assets 2.1 13. Rate earned on total assets 8.5% 14. Rate earned on stockholders' equity 12.0% 15. Rate earned on common stockholders' equity 14.2% 16. Earnings per share on common stock $3.65 17. Price-earnings ratio 9.2 18. Dividends per share $0.80 19. Dividend yield 2.50%12-31-2010 Percentage 12-31-2009 Percentage Assets Current Assets Cash $235,000 100%% $215,000 100% Temporary Investments $10,000 4% $50,000 23% Accounts Receivable (Net) $525,000 223% $425,000 198% Inventories $940,000 400% $580,000 270% Prepaid Expenses $30,000 13% $20,000 9% Total Current Assets $1,740,000 740% $1,290,000 600% Long-Term Investments $165,000 70% $135,000 63% Property, Plant and Equipment (Net) $2,525,000 1074% $1 878,000 873% Total Assets $4,430,000 2626% $3,303,000 936% Liabilities Current Liabilities $950,000 404% $780,000 3.62790698 Long-Term Liabilities Mortgage Note Payable 8% (due 2013) $410,000 174 0% Bonds Payable, 7% (due 2016) $1,200,000 511% $800,000 372% Total Long Term Liabilities $1,610,000 685% $800,000 372% Total Liabilities $2,560,000 1089% $1,580,000 744%
Step by Step Solution
There are 3 Steps involved in it

Get step-by-step solutions from verified subject matter experts