

Question: B.) create a scatter plot using years since 1980 and insert trend line and display equation. Find the equation for the line which goes through
B.) create a scatter plot using years since 1980 and insert trend line and display equation. Find the equation for the line which goes through the first and last points by computing the slope. Format to two decimals places for accuracy 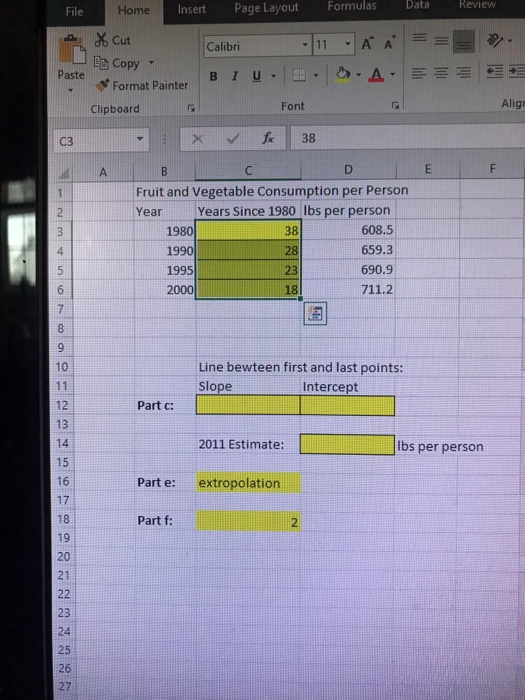
Insert Page Layout Formulasata ev Review File Home Calibri Copy ? Format Painter | B | U ?? ? |? ?O-A-| Paste ? Clipboard Font Align C3 Fruit and Vegetable Consumption per Persorn Year Years Since 1980 Ibs per person 1980 1990 1995 38 28 23 18 608.5 659.3 690.9 9 10 Line bewteen first and last points: Slope Intercept 12 13 14 15 16 17 18 19 20 21 Part c: 2011 Estimate: lbs per person Part e: extropolation Part f 23 24 25 26 27
Step by Step Solution
There are 3 Steps involved in it
1 Expert Approved Answer
Step: 1 Unlock

Question Has Been Solved by an Expert!
Get step-by-step solutions from verified subject matter experts
Step: 2 Unlock
Step: 3 Unlock