

Question: A.) enter a formula which computed the years since 1980. B.) create a scatter plot using years since 1980 and insert trendline and display equation.
A.) enter a formula which computed the years since 1980.
B.) create a scatter plot using years since 1980 and insert trendline and display equation.
C). Find the equation for the line which goes through the first and last points by computing the slope.
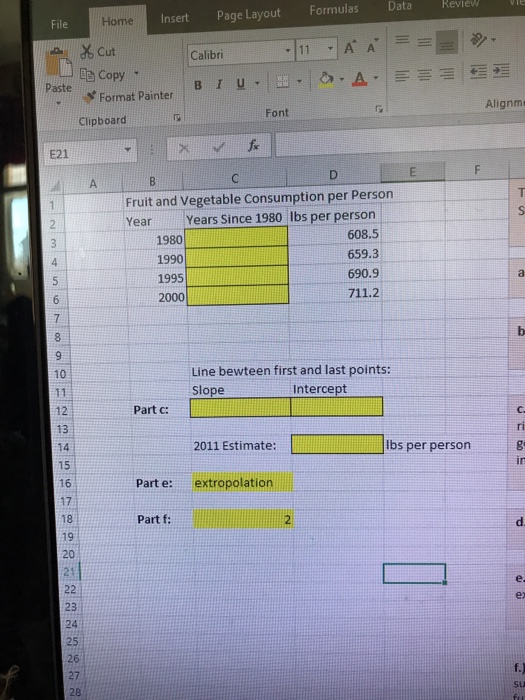
Insert Page Layout Formulas DataReviewU Home Cut EE Copy File Calibri Paste Alignm Font Clipboard E21 Fruit and Vegetable Consumption per Person Year Years Since 1980 lbs per person 1980 1990 1995 2000 608.5 659.3 690.9 4 Line bewteen first and last points: Slope 10 Intercept Part c: 13 14 15 16 17 ibs per person Part e: extropolation Part f 19 20 e. ex 23 24: 25 26 i 27 28
Step by Step Solution
There are 3 Steps involved in it
1 Expert Approved Answer
Step: 1 Unlock

Question Has Been Solved by an Expert!
Get step-by-step solutions from verified subject matter experts
Step: 2 Unlock
Step: 3 Unlock