

Question: B D A Trance Electronics 1 2 13 Data 14 15 Market size 120,000,000 16 Unit (monthly Rx) revenue $ 120.00 7 Unit (monthly Rx)
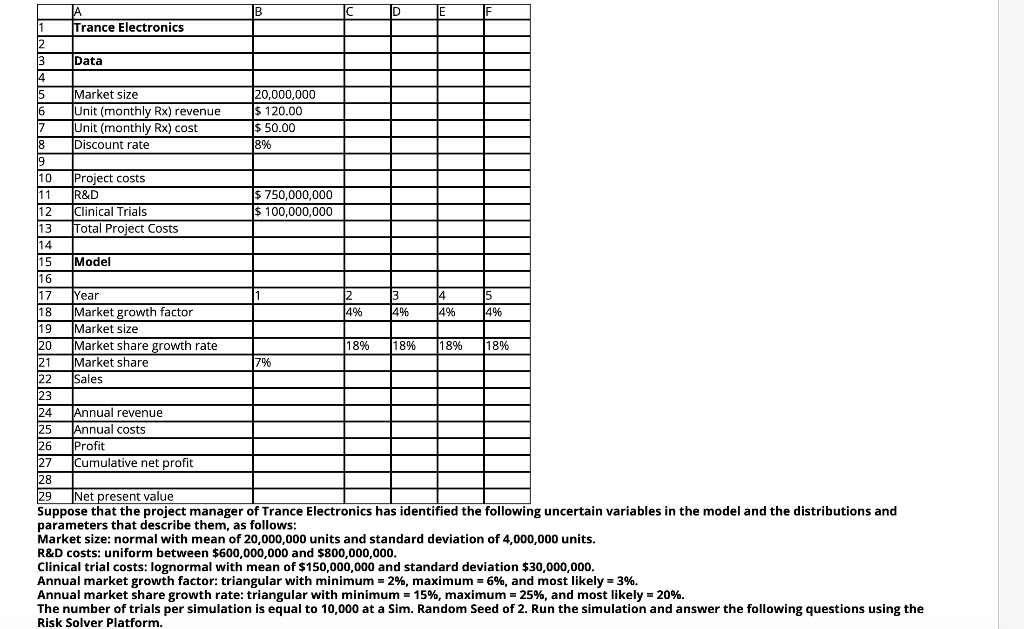

B D A Trance Electronics 1 2 13 Data 14 15 Market size 120,000,000 16 Unit (monthly Rx) revenue $ 120.00 7 Unit (monthly Rx) cost $ 50.00 8 Discount rate 8% 9 10 Project costs 11 R&D $ 750,000,000 12 Clinical Trials $ 100,000,000 13 Total Project Costs 14 15 Model 116 17 Year 12 3 14 15 18 Market growth factor 14% 4% 4% 14% 19 Market size 20 Market share growth rate 18% 18% 18% 18% 21 Market share 22 Sales 23 ha 24 Annual revenue 25 Annual costs 26 Profit 27 Cumulative net profit 28 29 Net present value Suppose that the project manager of Trance Electronics has identified the following uncertain variables in the model and the distributions and parameters that describe them, as follows: Market size: normal with mean of 20,000,000 units and standard deviation of 4,000,000 units. R&D costs: uniform between $600,000,000 and $800,000,000. Clinical trial costs: lognormal with mean of $150,000,000 and standard deviation $30,000,000. Annual market growth factor: triangular with minimum = 2%, maximum = 6%, and most likely = 3%. Annual market share growth rate: triangular with minimum = 15%, maximum = 25%, and most likely = 20%. The number of trials per simulation is equal to 10,000 at a Sim. Random Seed of 2. Run the simulation and answer the following questions using the Risk Solver Platform. 7% With reference to the trend chart, which year shows the highest uncertainty in forecasting the future? Year 4 Year 1 Year 5 Year 3 B D A Trance Electronics 1 2 13 Data 14 15 Market size 120,000,000 16 Unit (monthly Rx) revenue $ 120.00 7 Unit (monthly Rx) cost $ 50.00 8 Discount rate 8% 9 10 Project costs 11 R&D $ 750,000,000 12 Clinical Trials $ 100,000,000 13 Total Project Costs 14 15 Model 116 17 Year 12 3 14 15 18 Market growth factor 14% 4% 4% 14% 19 Market size 20 Market share growth rate 18% 18% 18% 18% 21 Market share 22 Sales 23 ha 24 Annual revenue 25 Annual costs 26 Profit 27 Cumulative net profit 28 29 Net present value Suppose that the project manager of Trance Electronics has identified the following uncertain variables in the model and the distributions and parameters that describe them, as follows: Market size: normal with mean of 20,000,000 units and standard deviation of 4,000,000 units. R&D costs: uniform between $600,000,000 and $800,000,000. Clinical trial costs: lognormal with mean of $150,000,000 and standard deviation $30,000,000. Annual market growth factor: triangular with minimum = 2%, maximum = 6%, and most likely = 3%. Annual market share growth rate: triangular with minimum = 15%, maximum = 25%, and most likely = 20%. The number of trials per simulation is equal to 10,000 at a Sim. Random Seed of 2. Run the simulation and answer the following questions using the Risk Solver Platform. 7% With reference to the trend chart, which year shows the highest uncertainty in forecasting the future? Year 4 Year 1 Year 5 Year 3
Step by Step Solution
There are 3 Steps involved in it

Get step-by-step solutions from verified subject matter experts