

Question: B D F H 2017 Preliminary forecast (doesn't include special dividend or LOC) $482,459 $410,090 $15,439 2017 Final forecast (Includes special dividend or LOC) 2016
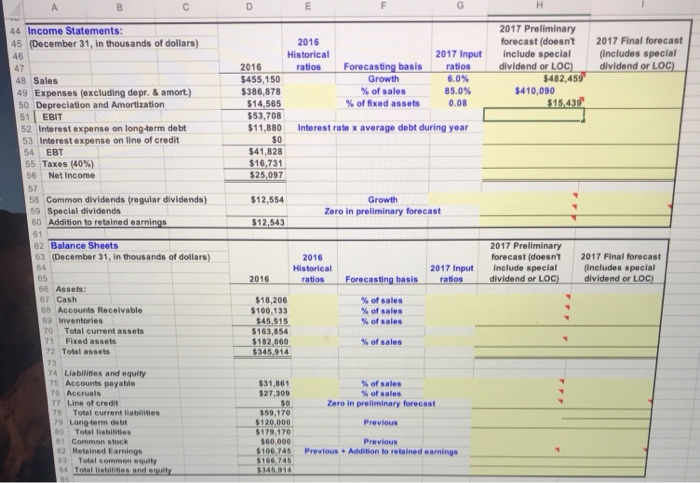
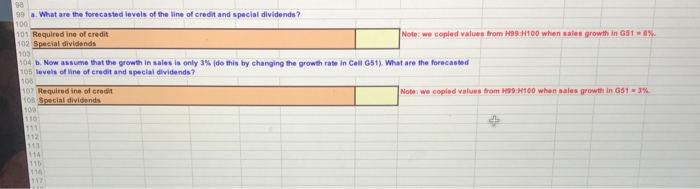
B D F H 2017 Preliminary forecast (doesn't include special dividend or LOC) $482,459 $410,090 $15,439 2017 Final forecast (Includes special dividend or LOC) 2016 Historical 2017 Input 2016 ratios Forecasting basis ratios $455,150 Growth 6.0% $386,878 % of sales 85.0% $14,565 % of fixed assets 0.08 $53,708 $11,880 Interest rate x average debt during year $0 $41,828 $16.731 $25,097 $12,554 Growth Zero in preliminary forecast $12,543 44 Income Statements: 45 (December 31, in thousands of dollars) 46 47 48 Sales 49 Expenses (excluding depr. & amort.) 50 Depreciation and Amortization 51 EBIT 52 Interest expense on long-term debt 53 Interest expense on line of credit 54 EBT 55 Taxes (40%) 56 Net Income 57 58 Common dividends (regular dividenda) 59 Special dividends 60 Addition to retained earnings 61 62 Balance Sheets 63 (December 31, in thousands of dollars) 64 65 66 Assets: 67 Cash 68 Accounts Receivable 69 Inventories 70 Total current assets 71 Fixed assets 72 Total assets 73 74 Liabilities and equity 75 Accounts payable 76 Accruals 77 Line of credit 78 Total current liabilities 79 Long-term debit 80 Total abilities 81 Common stock 82 Retained Earnings Total common equity 14 Total Ilabilities and equity 2016 Historical ratios 2017 Preliminary forecast (doesn't include special dividend or LOC) 2017 Final forecast (includes special dividend or LOC) 2017 Input ratios 2016 Forecasting basis % of sales % of sales % of sales $18,206 $100,133 $45,515 $163,854 $182,060 $345,914 % of sales $31,861 $27,309 % of sales % of sales Zero in preliminary forecast Previous $59,170 $120,000 $179,170 360,000 $106.745 5166,745 $345,914 Previous Previous . Addition to retained earnings 98 99 a. What are the forecasted levels of the line of credit and special dividends? 100 101 Required ine of credit Note: we copied values from H99 H100 when sales growth in G51 6% 102 Special dividends 103 104 b. Now assume that the growth in sales is only 3% (do this by changing the growth rate in Cell G51). What are the forecasted 105 levels of line of credit and special dividends? 100 107 Required ine of credit Note: we copled values from 99:1100 when sales growth in G51 - 3%. 108 Special dividends 109 110 111 + 112 113 116 117 B D F H 2017 Preliminary forecast (doesn't include special dividend or LOC) $482,459 $410,090 $15,439 2017 Final forecast (Includes special dividend or LOC) 2016 Historical 2017 Input 2016 ratios Forecasting basis ratios $455,150 Growth 6.0% $386,878 % of sales 85.0% $14,565 % of fixed assets 0.08 $53,708 $11,880 Interest rate x average debt during year $0 $41,828 $16.731 $25,097 $12,554 Growth Zero in preliminary forecast $12,543 44 Income Statements: 45 (December 31, in thousands of dollars) 46 47 48 Sales 49 Expenses (excluding depr. & amort.) 50 Depreciation and Amortization 51 EBIT 52 Interest expense on long-term debt 53 Interest expense on line of credit 54 EBT 55 Taxes (40%) 56 Net Income 57 58 Common dividends (regular dividenda) 59 Special dividends 60 Addition to retained earnings 61 62 Balance Sheets 63 (December 31, in thousands of dollars) 64 65 66 Assets: 67 Cash 68 Accounts Receivable 69 Inventories 70 Total current assets 71 Fixed assets 72 Total assets 73 74 Liabilities and equity 75 Accounts payable 76 Accruals 77 Line of credit 78 Total current liabilities 79 Long-term debit 80 Total abilities 81 Common stock 82 Retained Earnings Total common equity 14 Total Ilabilities and equity 2016 Historical ratios 2017 Preliminary forecast (doesn't include special dividend or LOC) 2017 Final forecast (includes special dividend or LOC) 2017 Input ratios 2016 Forecasting basis % of sales % of sales % of sales $18,206 $100,133 $45,515 $163,854 $182,060 $345,914 % of sales $31,861 $27,309 % of sales % of sales Zero in preliminary forecast Previous $59,170 $120,000 $179,170 360,000 $106.745 5166,745 $345,914 Previous Previous . Addition to retained earnings 98 99 a. What are the forecasted levels of the line of credit and special dividends? 100 101 Required ine of credit Note: we copied values from H99 H100 when sales growth in G51 6% 102 Special dividends 103 104 b. Now assume that the growth in sales is only 3% (do this by changing the growth rate in Cell G51). What are the forecasted 105 levels of line of credit and special dividends? 100 107 Required ine of credit Note: we copled values from 99:1100 when sales growth in G51 - 3%. 108 Special dividends 109 110 111 + 112 113 116 117
Step by Step Solution
There are 3 Steps involved in it

Get step-by-step solutions from verified subject matter experts