

Question: Please show the formulas to solve in excel please show how to solve using excel --please provide formulas Start with the partial model in the
Please show the formulas to solve in excel
please show how to solve using excel --please provide formulas
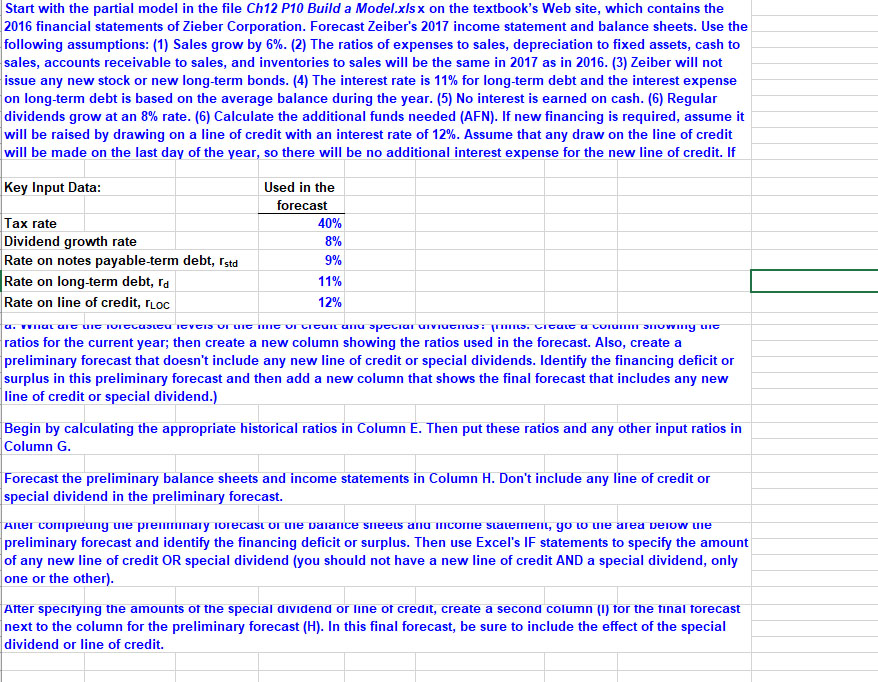
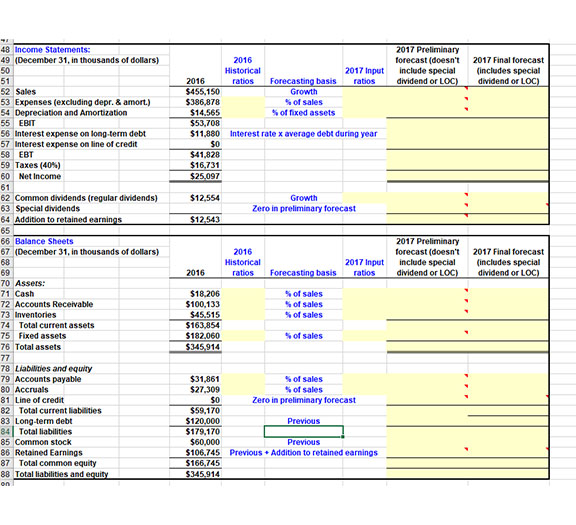
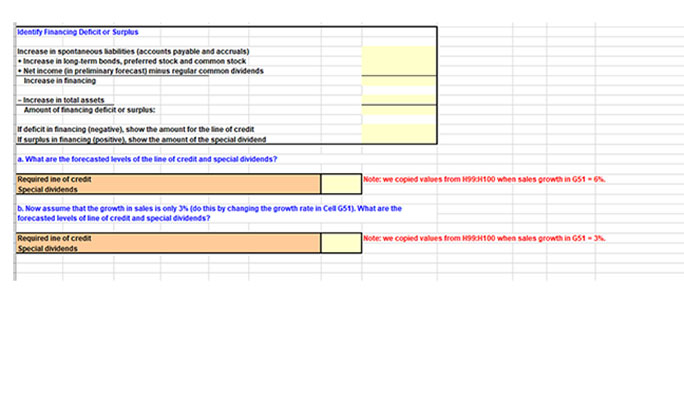
Start with the partial model in the file Ch12 P10 Build a Model.xlsx on the textbook's Web site, which contains the 2016 financial statements of Zieber Corporation. Forecast Zeiber's 2017 income statement and balance sheets. Use the following assumptions: (1) Sales grow by 6%. (2) The ratios of expenses to sales, depreciation to fixed assets, cash to sales, accounts receivable to sales, and inventories to sales will be the same in 2017 as in 2016. (3) Zeiber will not issue any new stock or new long-term bonds. (4) The interest rate is 11% for long-term debt and the interest expense on long-term debt is based on the average balance during the year. (5) No interest is earned on cash. (6) Regular dividends grow at an 8% rate. (6) Calculate the additional funds needed (AFN). If new financing is required, assume it will be raised by drawing on a line of credit with an interest rate of 12%. Assume that any draw on the line of credit will be made on the last day of the year, so there will be no additional interest expense for the new line of credit. If Key Input Data: Used in the forecast Tax rate 40% Dividend growth rate 8% Rate on notes payable-term debt, Istd 9% Rate on long-term debt, rd 11% Rate on line of credit, lloc 12% . u o us: . g ratios for the current year; then create a new column showing the ratios used in the forecast. Also, create a preliminary forecast that doesn't include any new line of credit or special dividends. Identify the financing deficit or surplus in this preliminary forecast and then add a new column that shows the final forecast that includes any new line of credit or special dividend.) Begin by calculating the appropriate historical ratios in Column E. Then put these ratios and any other input ratios in Column G. Forecast the preliminary balance sheets and income statements in Column H. Don't include any line of credit or special dividend in the preliminary forecast. Aller compreung the premmary worecast or te varance sneets and income statement, go w we area veiw me preliminary forecast and identify the financing deficit or surplus. Then use Excel's IF statements to specify the amount of any new line of credit OR special dividend (you should not have a new line of credit AND a special dividend, only one or the other). After specifying the amounts of the special dividend or line of credit, create a second column (1) for the final forecast next to the column for the preliminary forecast (H). In this final forecast, be sure to include the effect of the special dividend or line of credit. 2017 Preliminary forecast (doesn't 2017 Final forecast include special (includes special dividend or LOC) dividend or LOC) 2016 Historical 2017 Input 2016 ratios Forecasting basis ratios $455,150 Growth $386,878 5 of sales $14.565 of fixed assets $53,708 $11.880 Interest rate x average debt during year SO $41,828 $16.731 $25.097 $12.554 Growth Zero in preliminary forecast $12,543 48 Income Statements: 49 (December 31, in thousands of dollars) 50 51 52 Sales 53 Expenses (excluding depr. & amort.) 54 Depreciation and Amortization 55 EBIT 56 Interest expense on long-term debt 57 Interest expense on line of credit 58 EBT 59 Taxes (40%) 60 Net Income 61 62 Common dividends (regular dividends) 63 Special dividends 64 Addition to retained earnings 65 66 Balance Sheets 67 (December 31, in thousands of dollars) 68 69 70 Assers: 71 Cash 72 Accounts Receivable 73 Inventories 74 Total current assets 75 Fixed assets 76 Total assets 77 78 Liabilities and equity 79 Accounts payable 80 Accruals 81 Line of credit 82 Total current liabilities 83 Long-term debt 84 Total liabilities 85 Common stock 86 Retained Earnings 87 Total common equity 88 Total liabilities and equity on 2016 Historical ratios 2017 Preliminary forecast (doesn't include special dividend or LOC) 2017 Final forecast (includes special dividend or LOC) 2017 Input ratios 2016 Forecasting basis S of sales S of sales S of sales $18.206 $100,133 $45.515 $163,854 $182,060 $345.914 % of sales $31,861 of sales $27.309 S of sales SO Zero in preliminary forecast $59,170 $120.000 Previous $179,170 $60,000 Previous $106.745 Previous . Addition to retained earnings S166.745 $345.914 Identify Financing Deficit or Surplus Increase in spontaneous abbies (accounts payable and accruats) Increase in long term bonds, preferred stock and common stock Net income in preliminary forecast) minus regular common dividends Increase in financing - Increase in total assets Amount of financing deficit or surpluse Geficit in financing (negative show the amount for the line of credit if surplus in financing positive), show the amount of the special dividend a. What are the forecasted levels of the line of credit and special dividends? Required ine of credit Nobec we copied values from 100 when sales growth in G51 Special dividends 6. Now assume that the growth in sales is only 3 (do this by changing the growth rate in Cell GS1). What are the forecasted levels of line of credit and special dividends? Required ine of credit Noter we copied values from 99.100 when sales growth in GS1 - 3%. Special vidends Start with the partial model in the file Ch12 P10 Build a Model.xlsx on the textbook's Web site, which contains the 2016 financial statements of Zieber Corporation. Forecast Zeiber's 2017 income statement and balance sheets. Use the following assumptions: (1) Sales grow by 6%. (2) The ratios of expenses to sales, depreciation to fixed assets, cash to sales, accounts receivable to sales, and inventories to sales will be the same in 2017 as in 2016. (3) Zeiber will not issue any new stock or new long-term bonds. (4) The interest rate is 11% for long-term debt and the interest expense on long-term debt is based on the average balance during the year. (5) No interest is earned on cash. (6) Regular dividends grow at an 8% rate. (6) Calculate the additional funds needed (AFN). If new financing is required, assume it will be raised by drawing on a line of credit with an interest rate of 12%. Assume that any draw on the line of credit will be made on the last day of the year, so there will be no additional interest expense for the new line of credit. If Key Input Data: Used in the forecast Tax rate 40% Dividend growth rate 8% Rate on notes payable-term debt, Istd 9% Rate on long-term debt, rd 11% Rate on line of credit, lloc 12% . u o us: . g ratios for the current year; then create a new column showing the ratios used in the forecast. Also, create a preliminary forecast that doesn't include any new line of credit or special dividends. Identify the financing deficit or surplus in this preliminary forecast and then add a new column that shows the final forecast that includes any new line of credit or special dividend.) Begin by calculating the appropriate historical ratios in Column E. Then put these ratios and any other input ratios in Column G. Forecast the preliminary balance sheets and income statements in Column H. Don't include any line of credit or special dividend in the preliminary forecast. Aller compreung the premmary worecast or te varance sneets and income statement, go w we area veiw me preliminary forecast and identify the financing deficit or surplus. Then use Excel's IF statements to specify the amount of any new line of credit OR special dividend (you should not have a new line of credit AND a special dividend, only one or the other). After specifying the amounts of the special dividend or line of credit, create a second column (1) for the final forecast next to the column for the preliminary forecast (H). In this final forecast, be sure to include the effect of the special dividend or line of credit. 2017 Preliminary forecast (doesn't 2017 Final forecast include special (includes special dividend or LOC) dividend or LOC) 2016 Historical 2017 Input 2016 ratios Forecasting basis ratios $455,150 Growth $386,878 5 of sales $14.565 of fixed assets $53,708 $11.880 Interest rate x average debt during year SO $41,828 $16.731 $25.097 $12.554 Growth Zero in preliminary forecast $12,543 48 Income Statements: 49 (December 31, in thousands of dollars) 50 51 52 Sales 53 Expenses (excluding depr. & amort.) 54 Depreciation and Amortization 55 EBIT 56 Interest expense on long-term debt 57 Interest expense on line of credit 58 EBT 59 Taxes (40%) 60 Net Income 61 62 Common dividends (regular dividends) 63 Special dividends 64 Addition to retained earnings 65 66 Balance Sheets 67 (December 31, in thousands of dollars) 68 69 70 Assers: 71 Cash 72 Accounts Receivable 73 Inventories 74 Total current assets 75 Fixed assets 76 Total assets 77 78 Liabilities and equity 79 Accounts payable 80 Accruals 81 Line of credit 82 Total current liabilities 83 Long-term debt 84 Total liabilities 85 Common stock 86 Retained Earnings 87 Total common equity 88 Total liabilities and equity on 2016 Historical ratios 2017 Preliminary forecast (doesn't include special dividend or LOC) 2017 Final forecast (includes special dividend or LOC) 2017 Input ratios 2016 Forecasting basis S of sales S of sales S of sales $18.206 $100,133 $45.515 $163,854 $182,060 $345.914 % of sales $31,861 of sales $27.309 S of sales SO Zero in preliminary forecast $59,170 $120.000 Previous $179,170 $60,000 Previous $106.745 Previous . Addition to retained earnings S166.745 $345.914 Identify Financing Deficit or Surplus Increase in spontaneous abbies (accounts payable and accruats) Increase in long term bonds, preferred stock and common stock Net income in preliminary forecast) minus regular common dividends Increase in financing - Increase in total assets Amount of financing deficit or surpluse Geficit in financing (negative show the amount for the line of credit if surplus in financing positive), show the amount of the special dividend a. What are the forecasted levels of the line of credit and special dividends? Required ine of credit Nobec we copied values from 100 when sales growth in G51 Special dividends 6. Now assume that the growth in sales is only 3 (do this by changing the growth rate in Cell GS1). What are the forecasted levels of line of credit and special dividends? Required ine of credit Noter we copied values from 99.100 when sales growth in GS1 - 3%. Special vidends
Step by Step Solution
There are 3 Steps involved in it

Get step-by-step solutions from verified subject matter experts