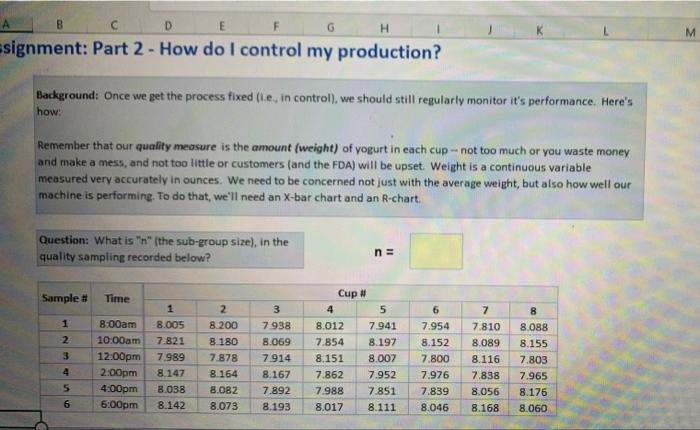
Question: B D G H ssignment: Part 2 - How do I control my production? Background: Once we get the process fixed (le, in control), we

B D G H ssignment: Part 2 - How do I control my
B D G H ssignment: Part 2 - How do I control my production? Background: Once we get the process fixed (le, in control), we should still regularly monitor it's performance. Here's how Remember that our quality measure is the amount (weight) of yogurt in each cup -- not too much or you waste money and make a mess, and not too little or customers (and the FDA) will be upset. Weight is a continuous variable measured very accurately in ounces. We need to be concerned not just with the average weight, but also how well our machine is performing. To do that, we'll need an X-bar chart and an R-chart. Question: What is "n" (the sub-group size), in the quality sampling recorded below? na Sample # Time 6 8 1 2 8:00am 10:00am 12:00pm 2:00pm 4:00pm 6:00pm 3 1 8.005 7.821 7.989 8.147 8.038 8.142 2 8.200 8.180 7.878 8.164 8.082 8.073 3 7938 8.069 7914 8.167 7.892 8.193 Cup # 4 5 8.012 7.941 7.854 8.197 8.151 8.007 7.862 7.952 7.988 7.851 8.017 8.111 7.954 8.152 7.800 7.976 7.839 8.046 7 7.810 8.089 8.116 7.838 8.056 8.168 8.088 8.155 7.803 7.965 8.176 8.060 5 6 Shawty Next, calculate the Sample Averages based on the above samples. This will ultimately help you calculate bar. Then calculate the range within each sample group. To calculate the range in a sample groun, use the following formula tange Maximum values of selected cells - Minimum values of selected cells Mellanuel MIN cell rangel 17 19 Range Average xar Activity Once you calculate the sample average and range within the Sample, you can calculate the Overall Averages for both. This gives the X-double bar and R-bar, which we need for our X-Bar and R-tar charts Sample Overall average * R ,, Activity in order to create the charts, we need to populate the constants below. You can find these in our textbook in Table 9.1 A2 DA D M N 0 33 34 Activity Use the formulas below to calculate the Upper Control Limit cucu. Center Line (Cu), and Lower Controllimit (LC) values. This will automatically populate the X-for Chart below. UCL = X-bar Chart UCLE CL LCL * + A, CL= LCL 4, R 100 80.50 10 80 5060 050 3040 0.10 - w Wmn 30 $ 0.10 0.00 1 2 3 6 7 3 Sample Ad Use the form belowe Canteces thes will math Roth here UL R Chart UCL D. * R X CLR !!!!! LCL D, R 1 . SE Shimano DO OD 0.00 ODO 0.00

Step by Step Solution

There are 3 Steps involved in it

1 Expert Approved Answer
Step: 1 Unlock blur-text-image
Question Has Been Solved by an Expert!

Get step-by-step solutions from verified subject matter experts

Step: 2 Unlock
Step: 3 Unlock

Students Have Also Explored These Related General Management Questions!