

Question: Assignment: Part 2 - How do I control my production? Background: Once we get the process fixed (i.e., in control), we should still regularly monitor
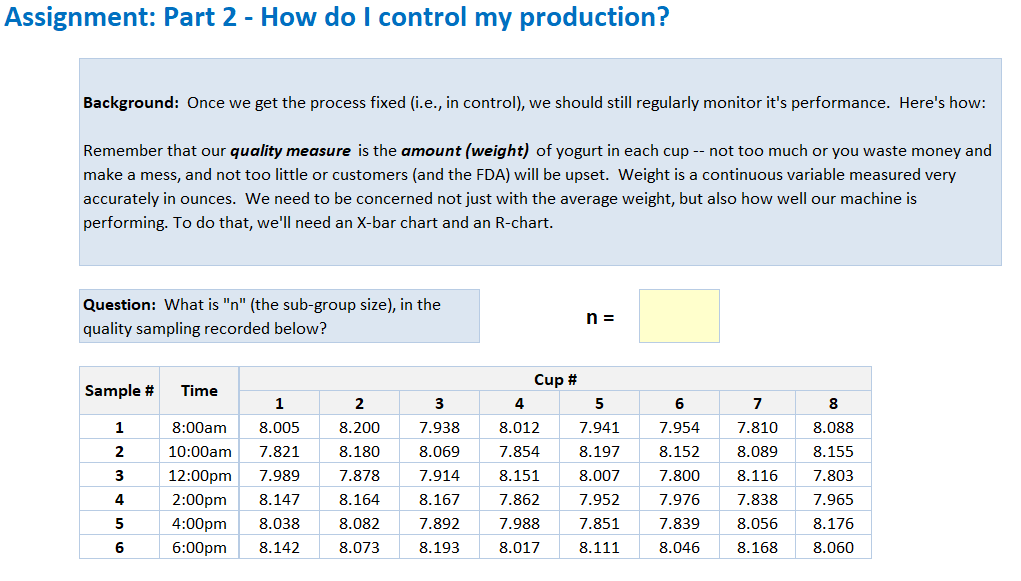
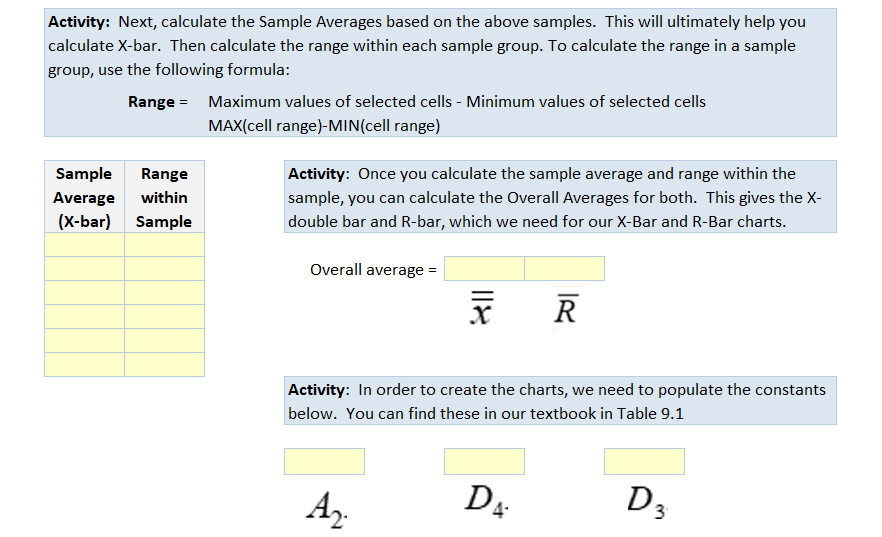
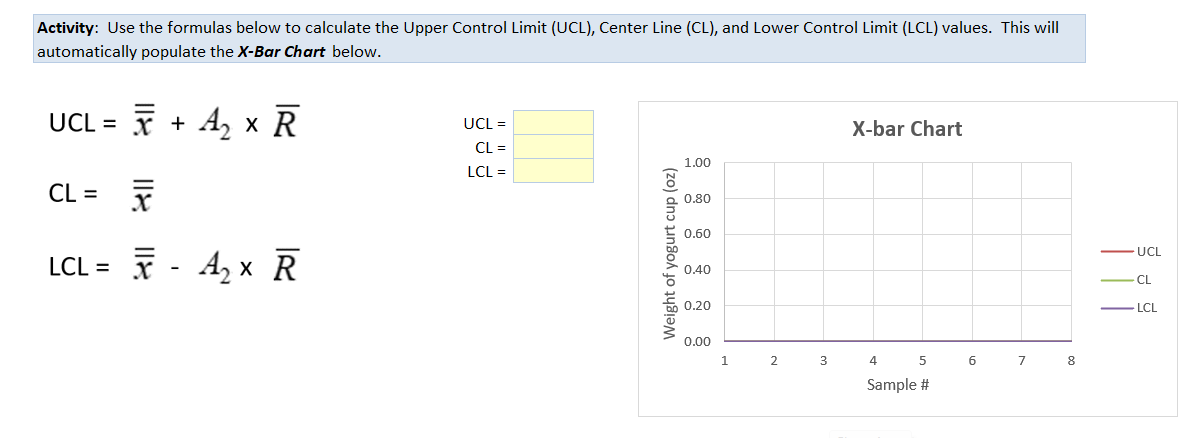
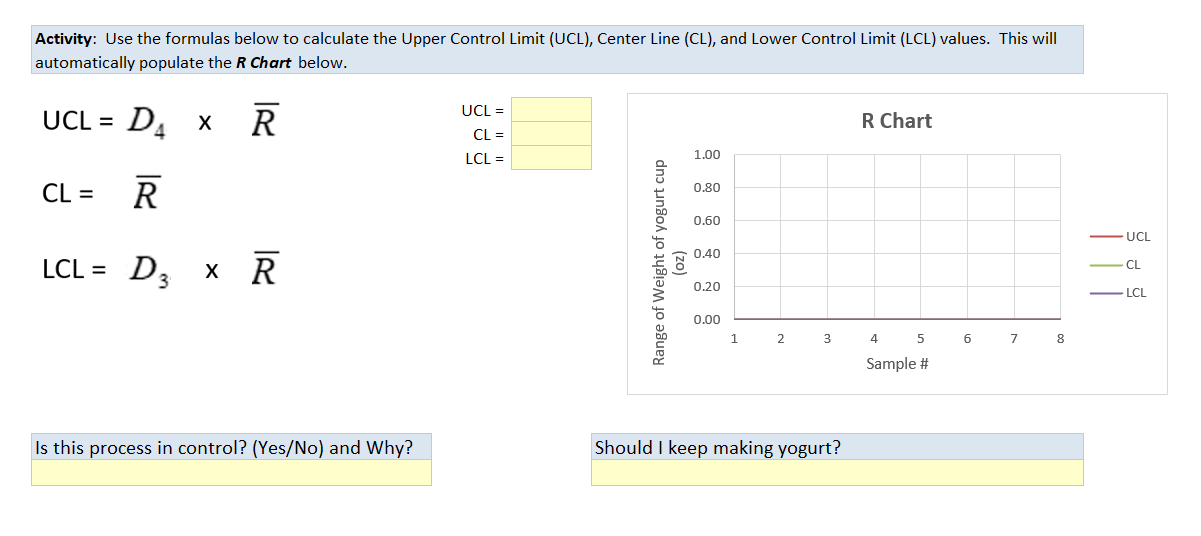
Assignment: Part 2 - How do I control my production? Background: Once we get the process fixed (i.e., in control), we should still regularly monitor it's performance. Here's how: Remember that our quality measure is the amount (weight) of yogurt in each cup -- not too much or you waste money and make a mess, and not too little or customers (and the FDA) will be upset. Weight is a continuous variable measured very accurately in ounces. We need to be concerned not just with the average weight, but also how well our machine is performing. To do that, we'll need an X-bar chart and an R-chart. Question: What is " n " (the sub-group size), in the quality sampling recorded below? n= Activity: Next, calculate the Sample Averages based on the above samples. This will ultimately help you calculate X-bar. Then calculate the range within each sample group. To calculate the range in a sample sroup, use the following formula: Range = Maximum values of selected cells Minimum values of selected cells MAX(cell range)-MIN(cell range) Activity: Once you calculate the sample average and range within the sample, you can calculate the Overall Averages for both. This gives the X double bar and R-bar, which we need for our X-Bar and R-Bar charts. Overall average = xR Activity: In order to create the charts, we need to populate the constants below. You can find these in our textbook in Table 9.1 Activity: Use the formulas below to calculate the Upper Control Limit (UCL), Center Line (CL), and Lower Control Limit (LCL) values. This will automatically populate the X-Bar Chart below. CL=x+A2RCL=xLCL=xA2RUCLRL=LCL= Activity: Use the formulas below to calculate the Upper Control Limit (UCL), Center Line (CL), and Lower Control Limit (LCL) values. This will automatically populate the R Chart below. UCL=D4RCL=RUCL=CL=LCL= Is this process in control? (Yes/No) and Why? Graph Data (automatically pulls entered values)
Step by Step Solution
There are 3 Steps involved in it

Get step-by-step solutions from verified subject matter experts