

Question: B. Determine the appropriate critical value(s) use a comma to separate answers as needed and round to three decimals places as needed.C. Since the test
B. Determine the appropriate critical value(s) use a comma to separate answers as needed and round to three decimals places as needed.C. Since the test statistic___ in the rejection region _____ h0. There is ____ evident to conclude that the mean of population 1 is different from the mean of population 2.D. Calculate p - value.E. Since the p value is____
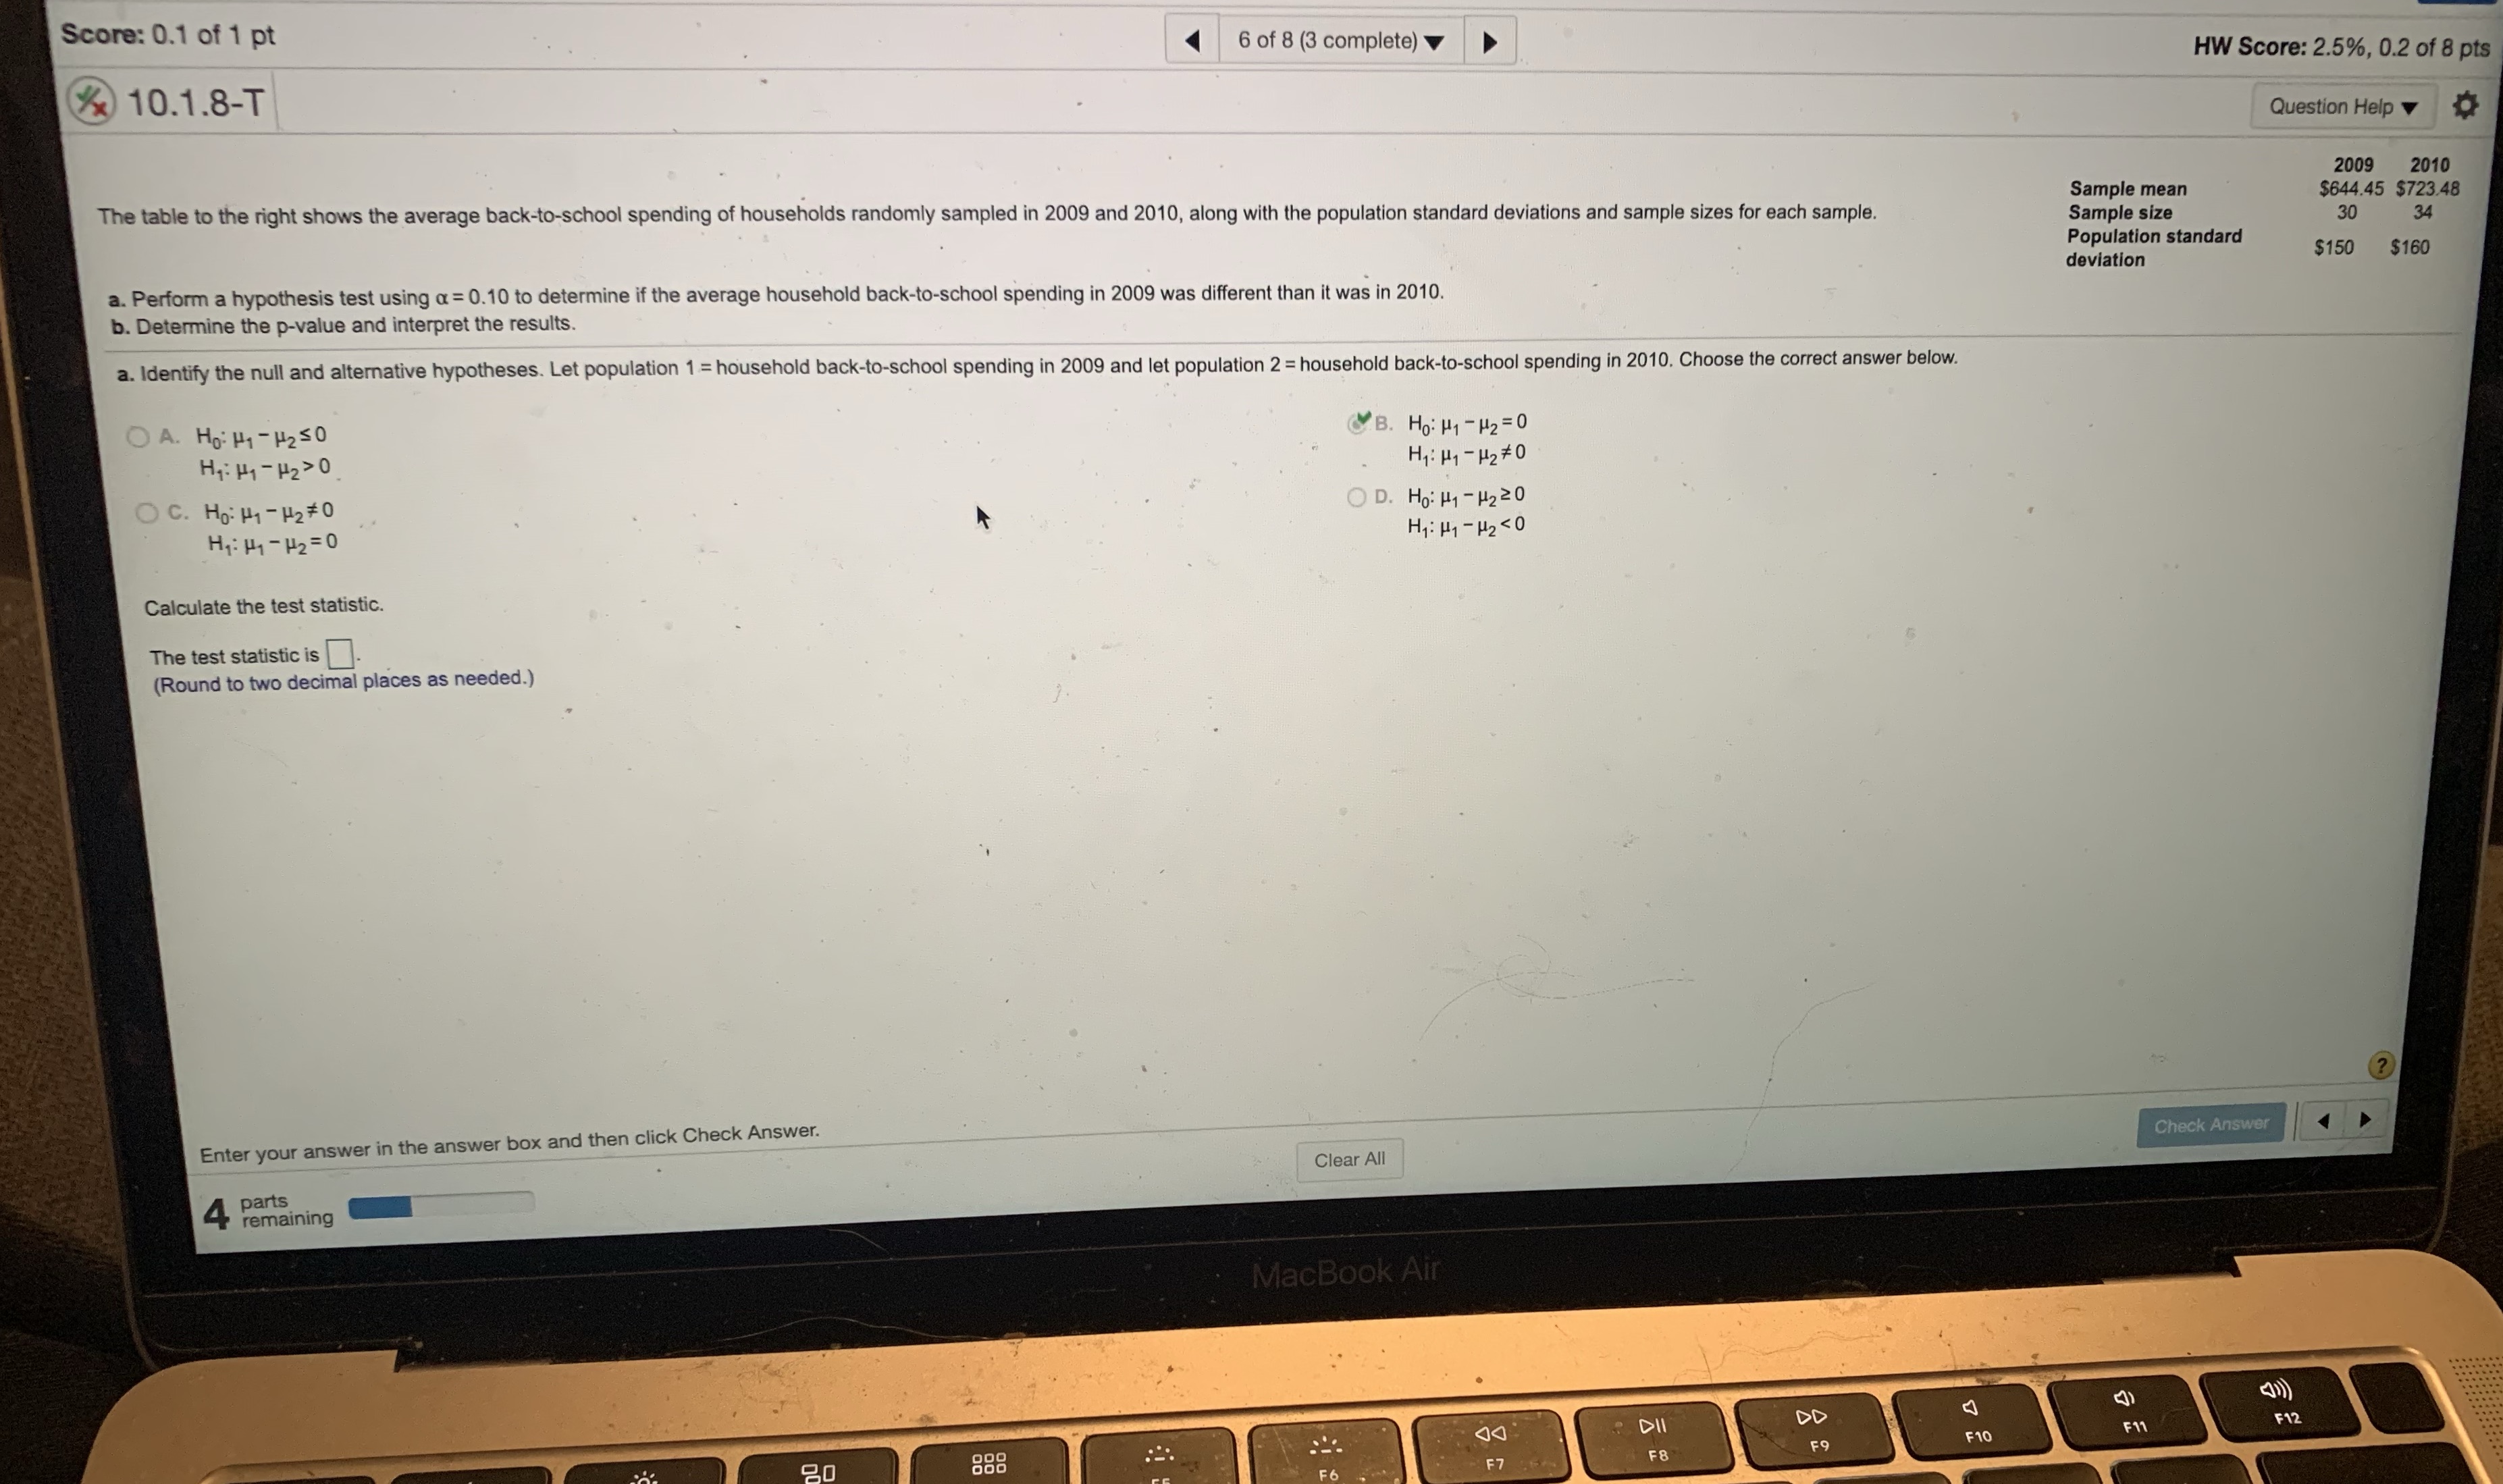
Score: 0.1 of 1 pt 6 of 8 (3 complete) HW Score: 2.5%, 0.2 of 8 pts x 10.1.8-T Question Help 2009 2010 Sample mean $644.45 $723.48 The table to the right shows the average back-to-school spending of households randomly sampled in 2009 and 2010, along with the population standard deviations and sample sizes for each sample. Sample size 30 34 Population standard $150 $160 deviation a. Perform a hypothesis test using a = 0.10 to determine if the average household back-to-school spending in 2009 was different than it was in 2010. b. Determine the p-value and interpret the results. a. Identify the null and alternative hypotheses. Let population 1 = household back-to-school spending in 2009 and let population 2 = household back-to-school spending in 2010. Choose the correct answer below. OA. Ho: H1 - H250 B. HO: H1 - H2= 0 Hy: Hy - H2>0 H1: H1 - H2 # 0 O C. Ho: Hy -H2# 0 OD. Ho: H1 - H2 20 H1: Hy - H2= 0 H1: H1 - H2
Step by Step Solution
There are 3 Steps involved in it

Get step-by-step solutions from verified subject matter experts