

Question: B. Determine the null and alternative hypothesesC. Draw a scatterplot Find p-value using a=0.05 D. Is there sufficient evidence to conclude that there is a
B. Determine the null and alternative hypothesesC. Draw a scatterplot Find p-value using a=0.05 D. Is there sufficient evidence to conclude that there is a linear correlation between the two variables?
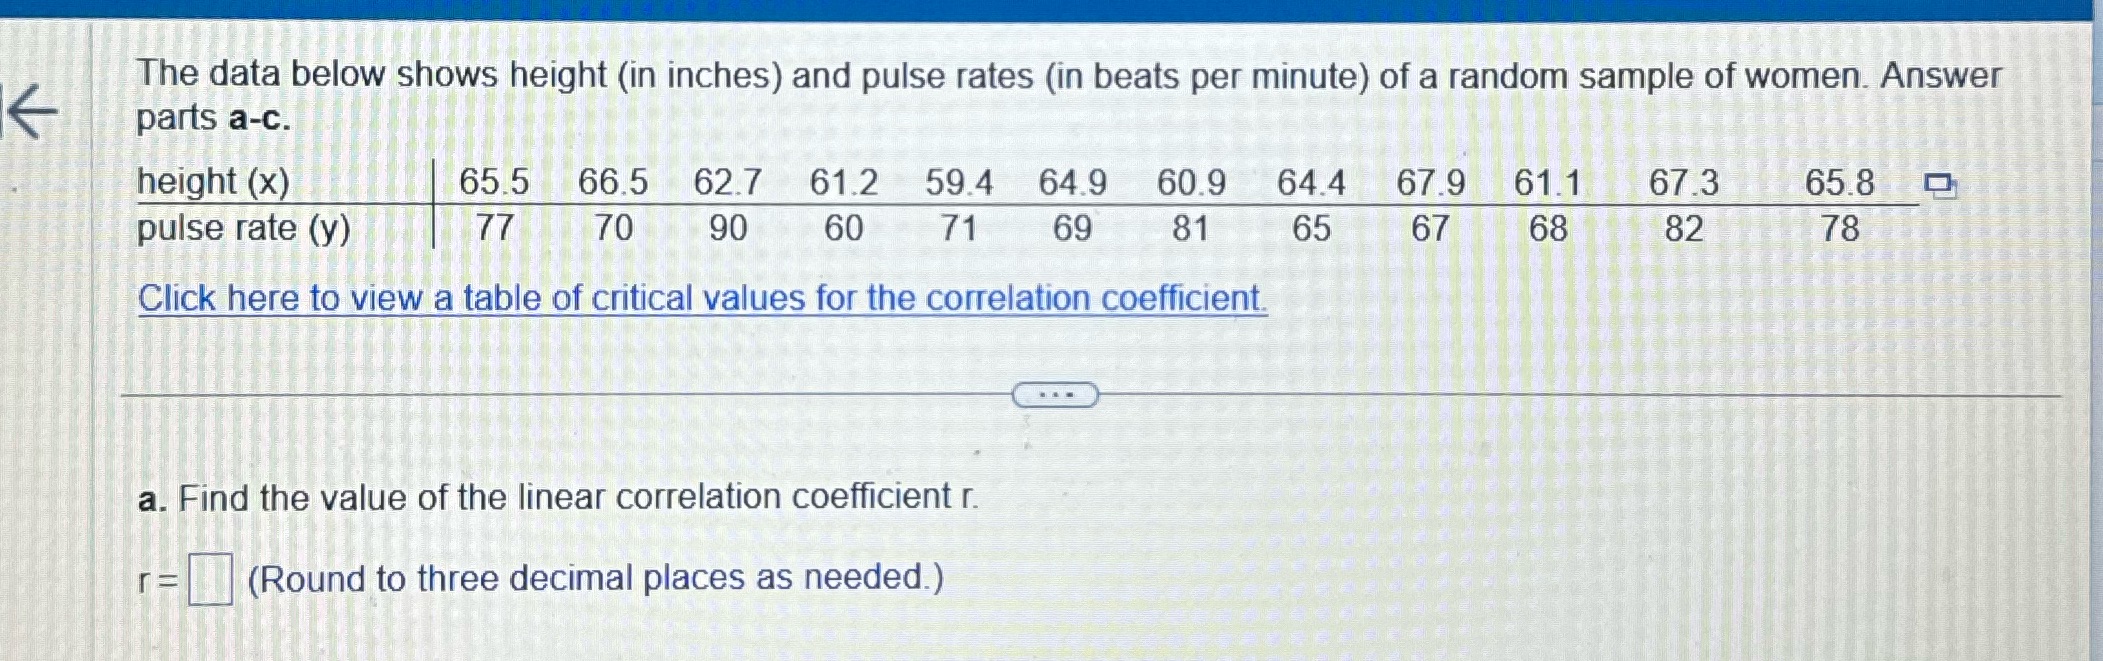
The data below shows height (in inches) and pulse rates (in beats per minute) of a random sample of women. Answer parts a-c. height (x) 859 665 627 612 594 649 609 644 679 611 673 658 pulse rate (y) |77 70453905 60= =71 =60 =-81=> bigseninTiliisn 82 78 Click here to view a table of critical values for the correlation coefficient. ) a. Find the value of the linear correlation coefficient r. = D (Round to three decimal places as needed.)
Step by Step Solution
There are 3 Steps involved in it

Get step-by-step solutions from verified subject matter experts