

Question: b) Does the scatter plot suggest a linear correlation between class size (x), and achievement test scores (3;)? If yes, what type of linear correlation

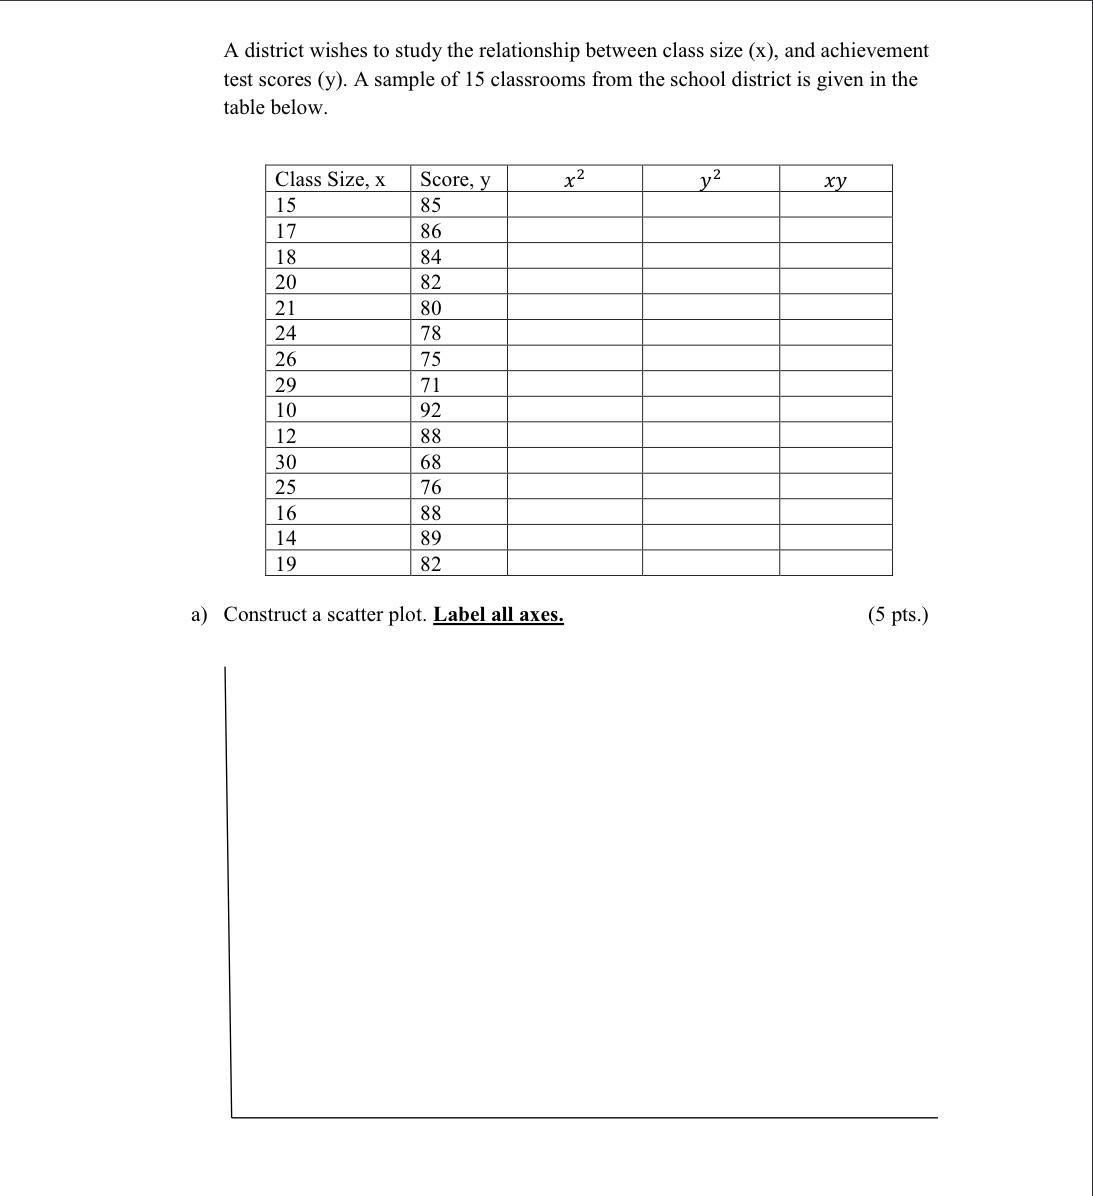


b) Does the scatter plot suggest a linear correlation between class size (x), and achievement test scores (3;)? If yes, what type of linear correlation exists? Why? (3ptS-) c) Find: (2 pts. each) E4 2m g) Predict the achievement score for a class of size 22. (2 pts.) h) Interpret the slope \"m\" in context of this problem. (2 pts.) d) Find: (3 pts. each) S, = S, = So = r = e) At the 0.05 level of significance test the claim "There is a significant linear correlation between class size (x), and achievement test scores (y). (10 pts.) f) Find the regression equation. (2 pts. each) m = b = Equation:A district wishes to study the relationship between class size (x), and achievement test scores (y). A sample of 15 classrooms from the school district is given in the table below. Class Size, x 15 l? 18 2O 21 24 26 29 10 12 3O 25 16 l4 l9 a) Construct a scatter plot. Label all axes. (5 pts.)
Step by Step Solution
There are 3 Steps involved in it

Get step-by-step solutions from verified subject matter experts