

Question: b) Draw a control chart for proportion defective showing the center line (CL), upper control limit (UCL), and lower control limit (LCL) and plotting the
b) Draw a control chart for proportion defective showing the center line (CL), upper control limit (UCL), and lower control limit (LCL) and plotting the ten points. ( Using 2 sigma
for calculation ) (10 marks)
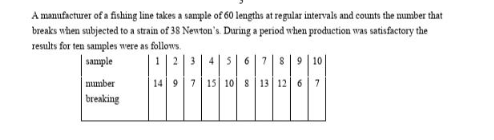
A manufacturer of a fiching line takes a sample of 60 lengths at regular intervals and counts the number that breaks when subjected to a strain of 38 Nenton's. During a period when production was satisfactory the results for ten samples were as followsStep by Step Solution
There are 3 Steps involved in it
1 Expert Approved Answer
Step: 1 Unlock

Question Has Been Solved by an Expert!
Get step-by-step solutions from verified subject matter experts
Step: 2 Unlock
Step: 3 Unlock