

Question: b. Draw a graph showing the marginal cost, average variable cost, and average cost curves. Using the tools provided plot 5 points for the
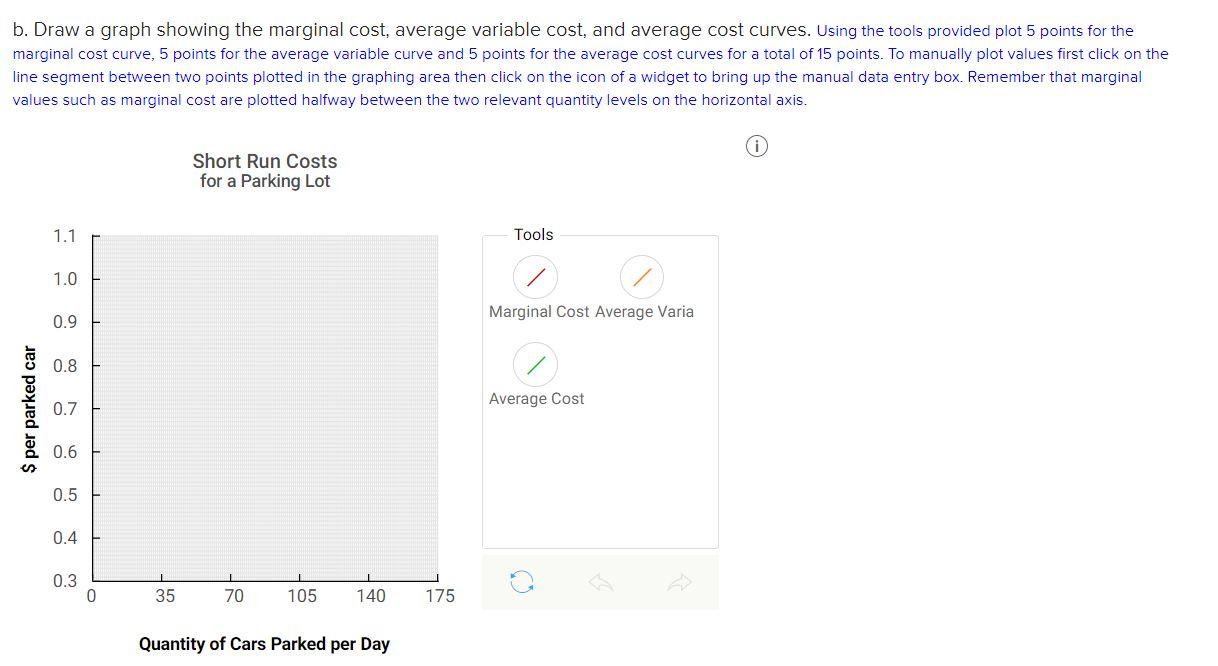
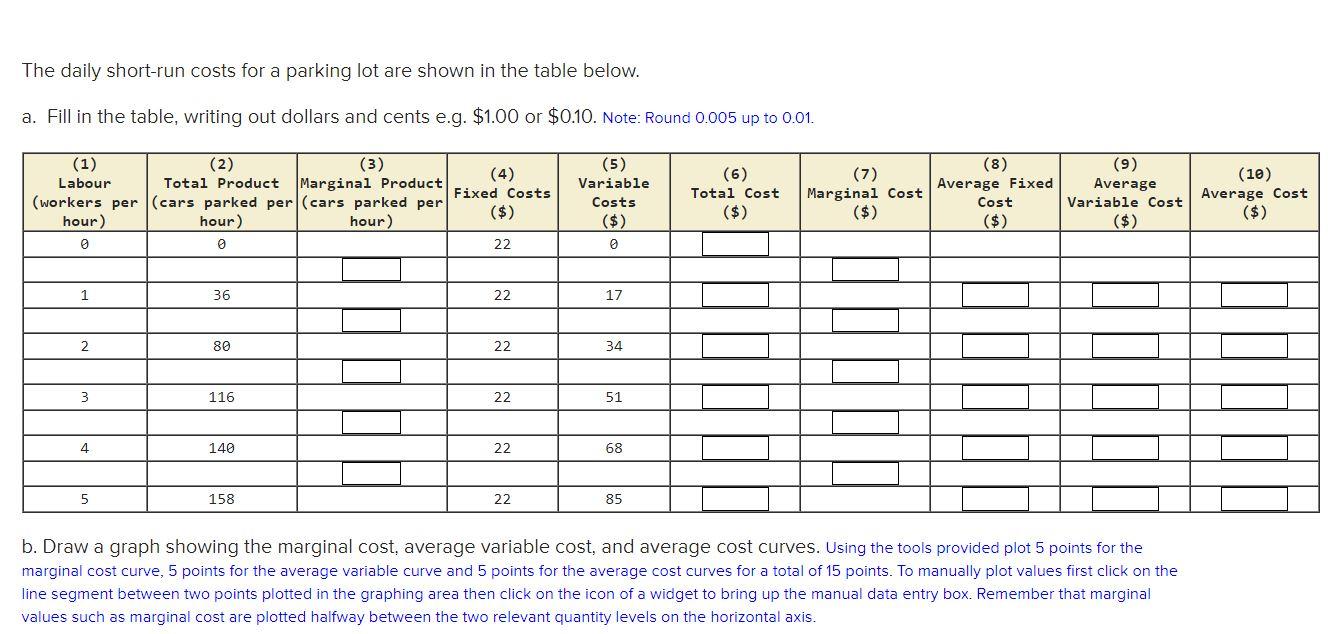
b. Draw a graph showing the marginal cost, average variable cost, and average cost curves. Using the tools provided plot 5 points for the marginal cost curve, 5 points for the average variable curve and 5 points for the average cost curves for a total of 15 points. To manually plot values first click on the line segment between two points plotted in the graphing area then click on the icon of a widget to bring up the manual data entry box. Remember that marginal values such as marginal cost are plotted halfway between the two relevant quantity levels on the horizontal axis. $ per parked car 1.1 1.0 0.9 0.8 0.7 0.6 0.5 0.4 0.3 0 35 Short Run Costs for a Parking Lot 70 105 140 Quantity of Cars Parked per Day 175 Tools Marginal Cost Average Varia Average Cost O The daily short-run costs for a parking lot are shown in the table below. a. Fill in the table, writing out dollars and cents e.g. $1.00 or $0.10. Note: Round 0.005 up to 0.01. (2) (3) (1) Labour Total Product Marginal Product (workers per (cars parked per (cars parked per hour) hour) hour) 0 0 1 2 3 4 5 36 80 116 140 158 (4) Fixed Costs ($) 22 22 22 22 22 22 (5) Variable Costs ($) 0 17 34 51 68 85 (6) Total Cost ($) (7) Marginal Cost ($) (8) Average Fixed Cost ($) (9) Average Variable Cost ($) b. Draw a graph showing the marginal cost, average variable cost, and average cost curves. Using the tools provided plot 5 points for the marginal cost curve, 5 points for the average variable curve and 5 points for the average cost curves for a total of 15 points. To manually plot values first click on the line segment between two points plotted in the graphing area then click on the icon of a widget to bring up the manual data entry box. Remember that marginal values such as marginal cost are plotted halfway between the two relevant quantity levels on the horizontal axis. (10) Average Cost ($)
Step by Step Solution
3.47 Rating (163 Votes )
There are 3 Steps involved in it
Here are the stepbystep calculations and cost curves based on the provided informat... View full answer

Get step-by-step solutions from verified subject matter experts