

Question: (b) Evaluate your expressions for three frequency bands (radio, optical, x-ray) centered on the frequencies given in Table 1. Use the Spectral Energy Distribution (SED)
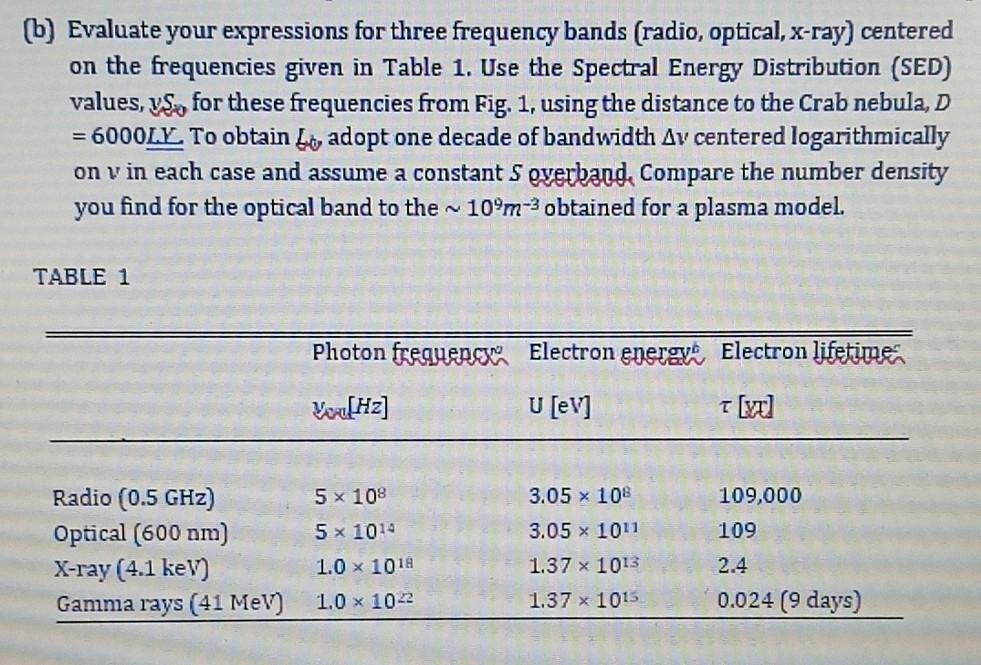
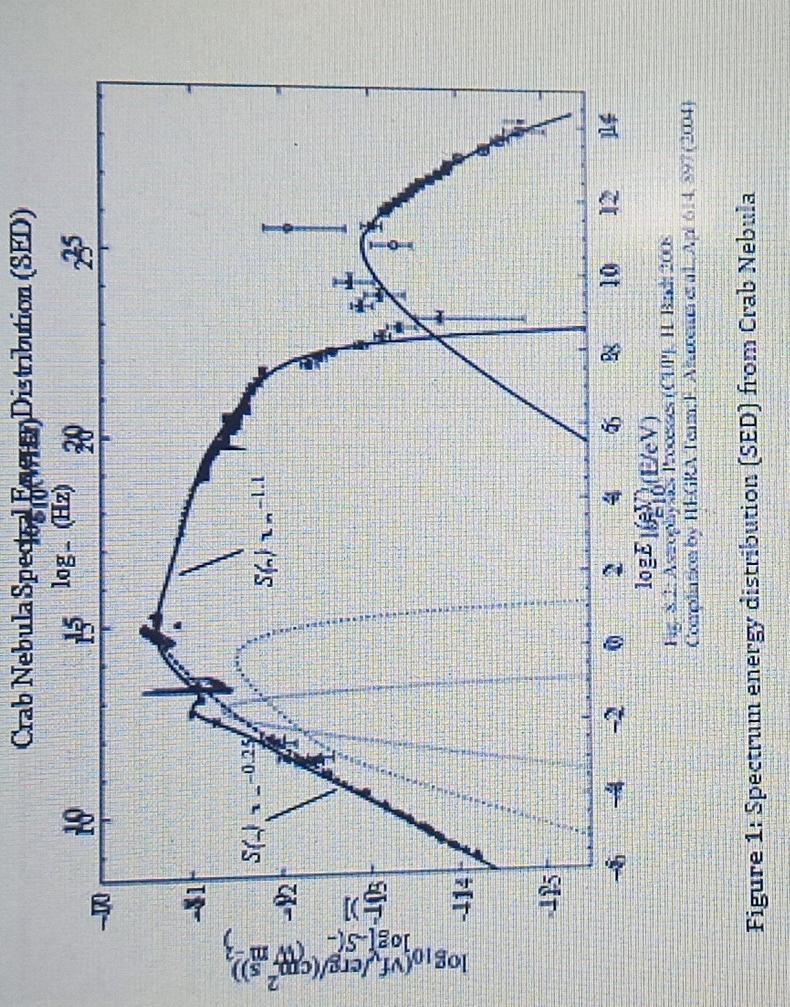
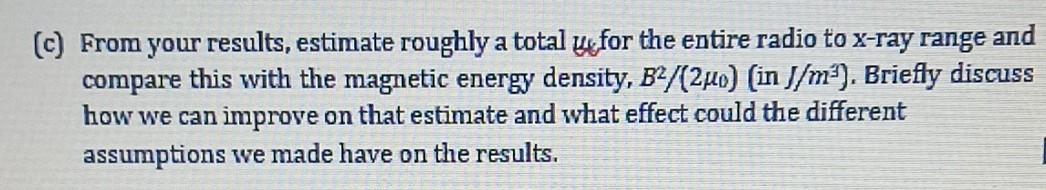
(b) Evaluate your expressions for three frequency bands (radio, optical, x-ray) centered on the frequencies given in Table 1. Use the Spectral Energy Distribution (SED) values, yS2 for these frequencies from Fig. 1, using the distance to the Crab nebula, D =6000LY. To obtain t, adopt one decade of bandwidth v centered logarithmically on v in each case and assume a constant S pyerband. Compare the number density you find for the optical band to the 109m3 obtained for a plasma model. Figure 1: Spectrum energy distribution [SED] from Crab Nebula (c) From your results, estimate roughly a total u4, for the entire radio to x-ray range and compare this with the magnetic energy density, B2/(20) (in J/m3). Briefly discuss how we can improve on that estimate and what effect could the different assumptions we made have on the results
Step by Step Solution
There are 3 Steps involved in it

Get step-by-step solutions from verified subject matter experts