

Question: (b) Explain any differences between r and S. for the two fits considered in part (a). A. The value of r is significantly larger for
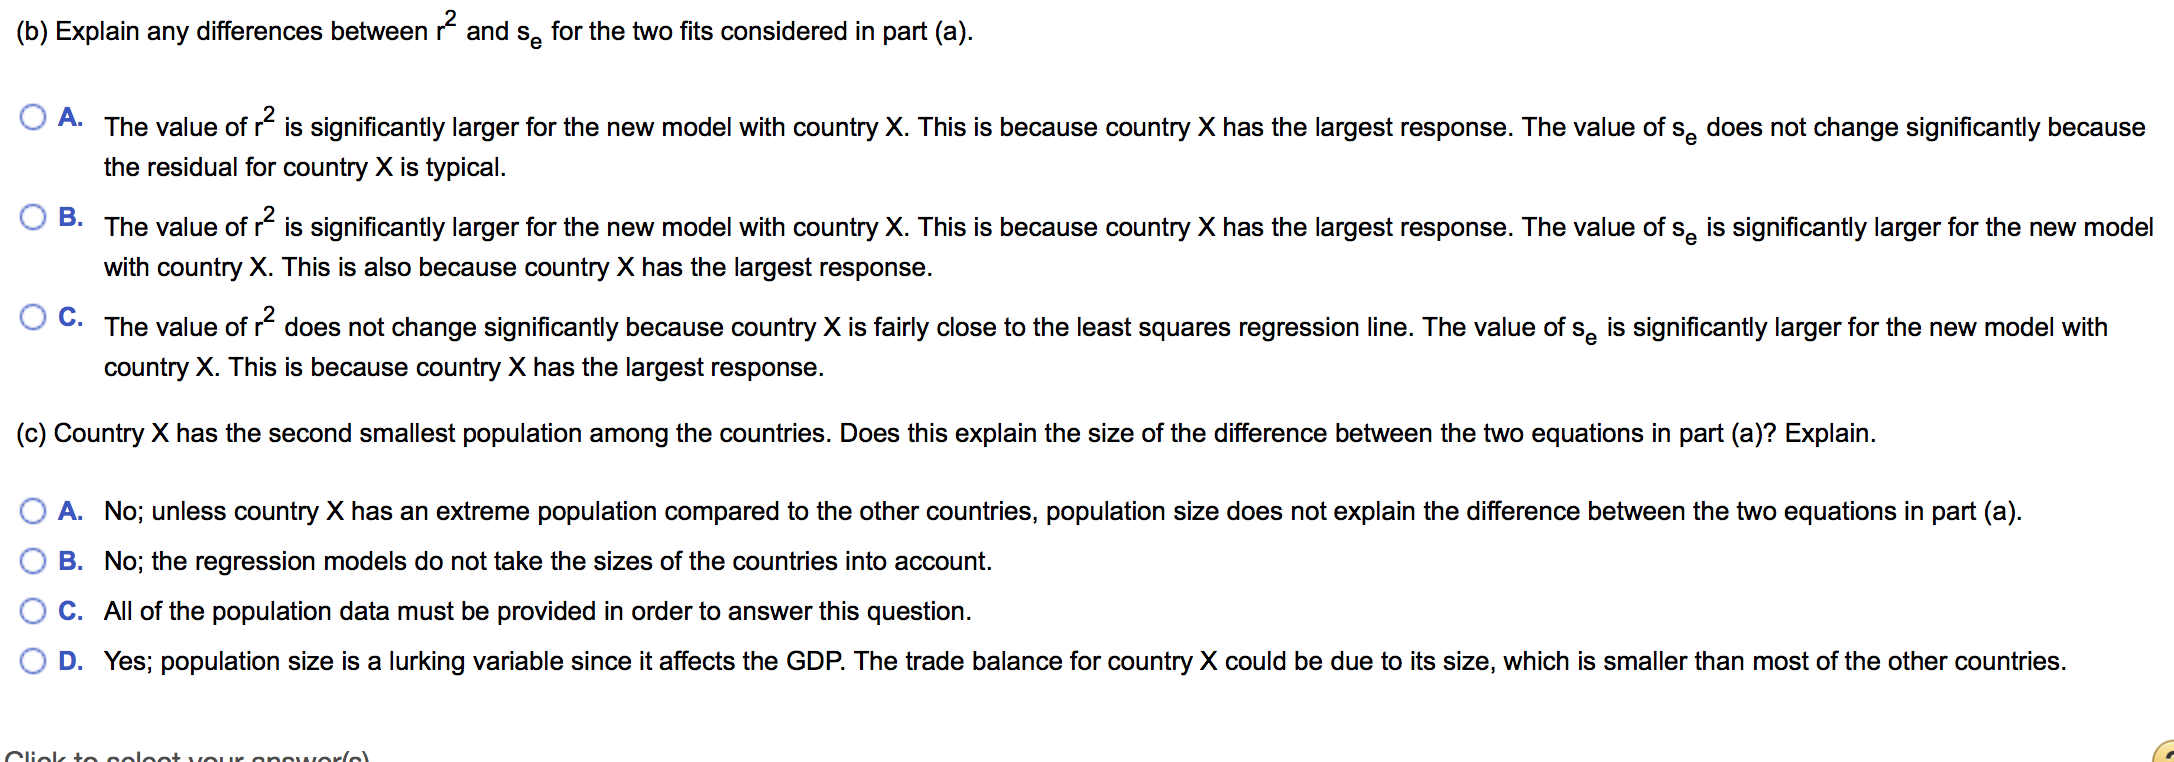
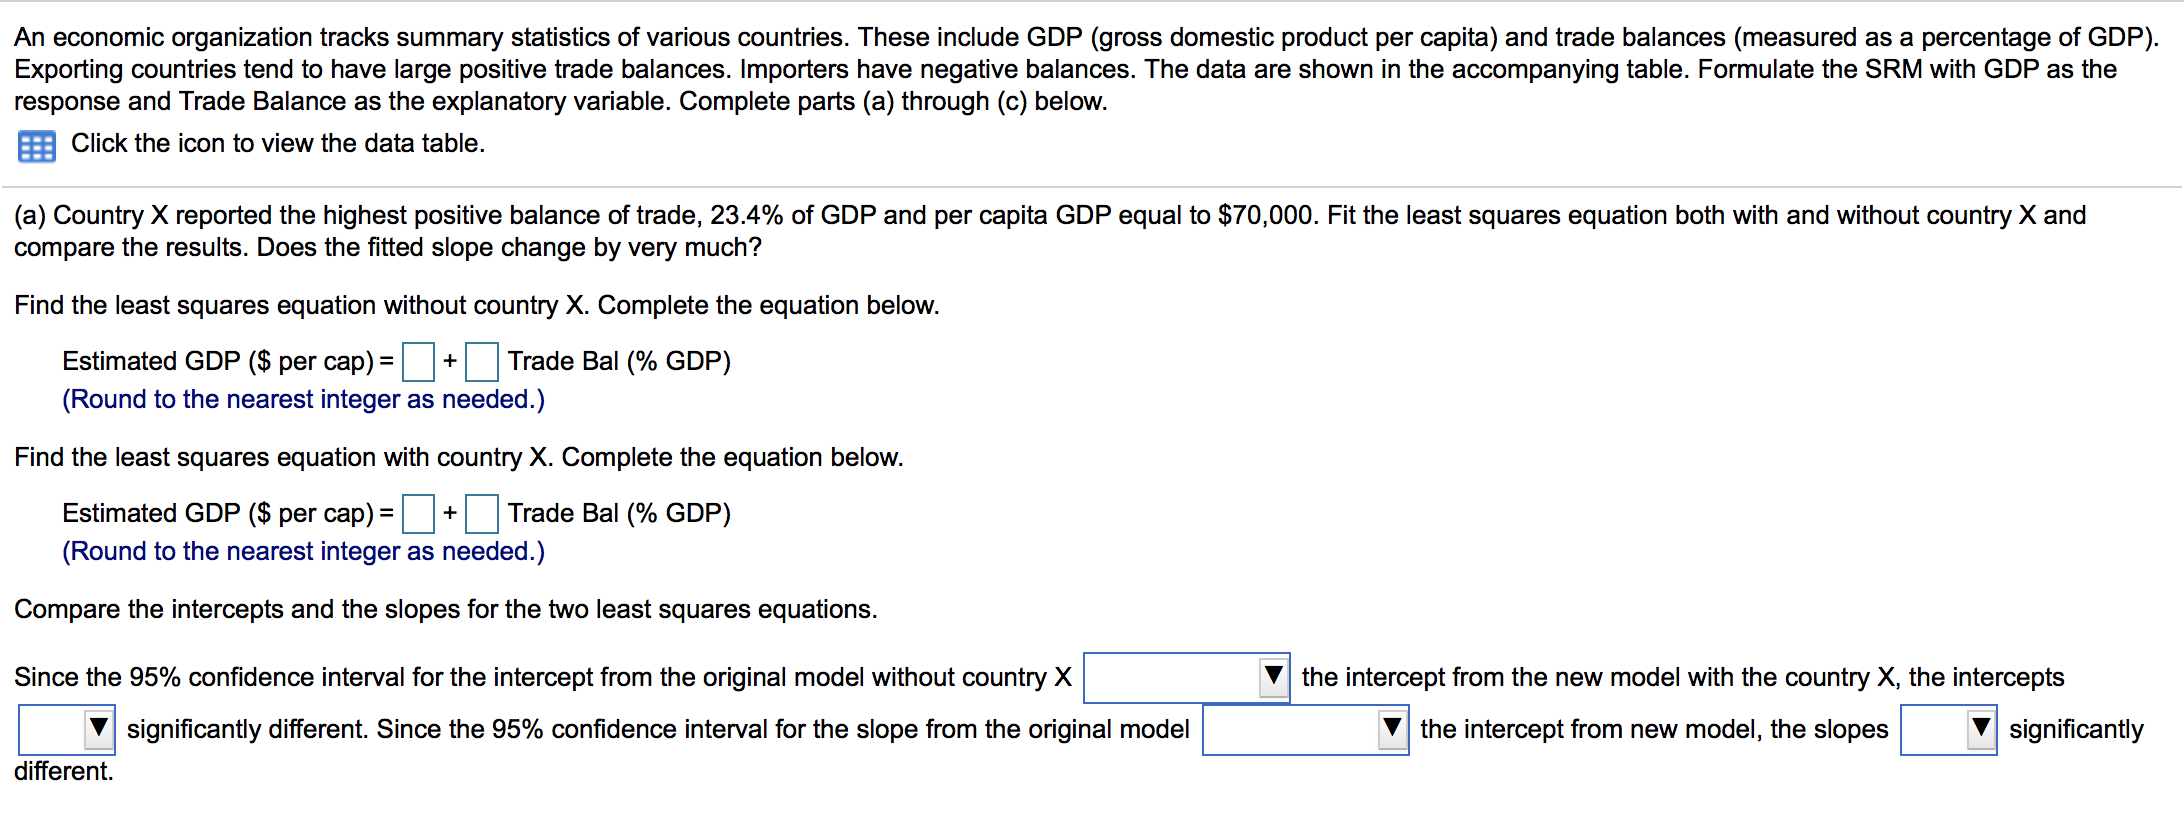
(b) Explain any differences between r and S. for the two fits considered in part (a). A. The value of r is significantly larger for the new model with country X. This is because country X has the largest response. The value of s. does not change significantly because the residual for country X is typical. OB. The value of r is significantly larger for the new model with country X. This is because country X has the largest response. The value of s. is significantly larger for the new model with country X. This is also because country X has the largest response. O C. The value of r does not change significantly because country X is fairly close to the least squares regression line. The value of s. is significantly larger for the new model with country X. This is because country X has the largest response. (c) Country X has the second smallest population among the countries. Does this explain the size of the difference between the two equations in part (a)? Explain. O A. No; unless country X has an extreme population compared to the other countries, population size does not explain the difference between the two equations in part (a). O B. No; the regression models do not take the sizes of the countries into account. O C. All of the population data must be provided in order to answer this question. O D. Yes; population size is a lurking variable since it affects the GDP. The trade balance for country X could be due to its size, which is smaller than most of the other countries.An economic organization tracks summary statistics of various countries. These include GDP (gross domestic product per capita) and trade balances (measured as a percentage of GDP). Exporting countries tend to have large positive trade balances. Importers have negative balances. The data are shown in the accompanying table. Formulate the SRM with GDP as the response and Trade Balance as the explanatory variable. Complete parts (a) through (c) below. a Click the icon to view the data table. (a) Country X reported the highest positive balance of trade, 23.4% of GDP and per capita GDP equal to $70,000. Fit the least squares equation both with and without country X and compare the results. Does the tted slope change by very much? Find the least squares equation without country X. Complete the equation below. Estimated GDP ($ per cap)= + (Trade Bal (% GDP) (Round to the nearest integer as needed.) Find the least squares equation with country X. Complete the equation below. Estimated GDP ($ per cap)= + (Trade Bal (% GDP) (Round to the nearest integer as needed.) Compare the intercepts and the slopes for the two least squares equations. Since the 95% condence interval for the intercept from the original model without country X V the intercept from the new model with the country X, the intercepts the intercept from new model, the slopes V signicantly V significantly different. Since the 95% condence interval for the slope from the original model different
Step by Step Solution
There are 3 Steps involved in it

Get step-by-step solutions from verified subject matter experts