

An economic organization tracks summary statistics of various countries. These include GDP (gross domestic product per...
Fantastic news! We've Found the answer you've been seeking!
Question:

Transcribed Image Text:
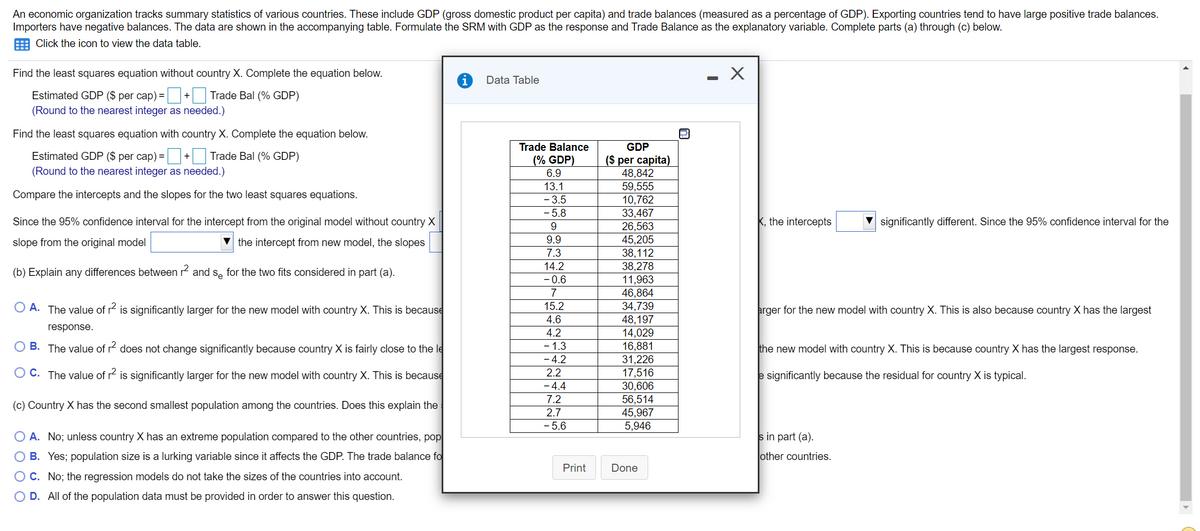
An economic organization tracks summary statistics of various countries. These include GDP (gross domestic product per capita) and trade balances (measured as a percentage of GDP). Exporting countries tend to have large positive trade balances. Importers have negative balances. The data are shown in the accompanying table. Formulate the SRM with GDP as the response and Trade Balance as the explanatory variable. Complete parts (a) through (c) below. Click the icon o view the data table. Find the least squares equation without country X. Complete the equation below. Estimated GDP ($ per cap) =+ Trade Bal (% GDP) (Round to the nearest integer as needed.). Find the least squares equation with country X. Complete the equation below. Estimated GDP ($ per cap) =+ Trade Bal (% GDP) (Round to the nearest integer as needed.) Compare the intercepts and the slopes for the two least squares equations. Since the 95% confidence interval for the intercept from the original model without country X slope from the original model the intercept from new model, the slopes (b) Explain any differences between and se for the two fits considered in part (a). the intercept from the new model with the country X, the intercepts ▼ significantly different. significantly different. Since the 95% confidence interval for the OA. The value of r² is significantly larger for the new model with country X. This is because country X has the largest response. The value of s, is significantly larger for the new model with country X. This is also because country X has the largest response. OB. The value of r² does not change significantly because country X is fairly close to the least squares regression line. The value of s, is significantly larger for the new model with country X. This is because country X has the largest response. OC. The value of r² is significantly larger for the new model with country X. This is because country X has the largest response. The value of s does not change significantly because the residual for country X is typical. (c) Country X has the second smallest population among the countries. Does this explain the size of the difference between the two equations in part (a)? Explain. O A. No; unless country X has an extreme population compared to the other countries, population size does not explain the difference between the two equations in part (a). OB. Yes; population size is a lurking variable since it affects the GDF trade balance for country X could I due to its siz which is smaller than most of the other countries. OC. No; the regression models do not take the sizes of the countries into account. O D. All of the population data must be provided in order to answer this question. An economic organization tracks summary statistics of various countries. These include GDP (gross domestic product per capita) and trade balances (measured as a percentage of GDP). Exporting countries tend to have large positive trade balances. Importers have negative balances. The data are shown in the accompanying table. Formulate the SRM with GDP as the response and Trade Balance as the explanatory variable. Complete parts (a) through (c) below. Click the icon to view the data table. Find the least squares equation without country X. Complete the equation below. Estimated GDP ($ per cap) =+ Trade Bal (% GDP) (Round to the nearest integer as needed.) Find the least squares equation with country X. Complete the equation below. Estimated GDP ($ per cap) =+ Trade Bal (% GDP) (Round to the nearest integer as needed.) Compare the intercepts and the slopes for the two least squares equations. Since the 95% confidence interval for the intercept from the original model without country X slope from the original model the intercept from new model, the slopes (b) Explain any differences between ² and so for the two fits considered in part (a). OA. The value of r2 is significantly larger for the new model with country X. This is because response. OB. The value of r² does not change significantly because country X is fairly close to the le OC. The value of r² is significantly larger for the new model with country X. This is because (c) Country X has the second smallest population among the countries. Does this explain the O A. No; unless country X has an extreme population compared to the other countries, pop O B. Yes; population size is a lurking variable since it affects the GDP. The trade balance fo OC. No; the regression models do not take the sizes of the countries into account. O D. All of the population data must be provided in order to answer this question. Data Table Trade Balance (% GDP) 6.9 13.1 -3.5 -5.8 9 9.9 7.3 14.2 -0.6 7 15.2 4.6 4.2 -1.3 -4.2 2.2 -4.4 7.2 2.7 -5.6 Print GDP ($ per capita) 48,842 59,555 10,762 33,467 26,563 45,205 38,112 38,278 11,963 46,864 34.739 48,197 14.029 16,881 31,226 17,516 30,606 56,514 45,967 5,946 Done - X k, the intercepts significantly different. Since the 95% confidence interval for the arger for the new model with country X. This is also because country X has the largest the new model with country X. This is because country X has the largest response. e significantly because the residual for country X is typical. s in part (a). other countries. An economic organization tracks summary statistics of various countries. These include GDP (gross domestic product per capita) and trade balances (measured as a percentage of GDP). Exporting countries tend to have large positive trade balances. Importers have negative balances. The data are shown in the accompanying table. Formulate the SRM with GDP as the response and Trade Balance as the explanatory variable. Complete parts (a) through (c) below. Click the icon o view the data table. Find the least squares equation without country X. Complete the equation below. Estimated GDP ($ per cap) =+ Trade Bal (% GDP) (Round to the nearest integer as needed.). Find the least squares equation with country X. Complete the equation below. Estimated GDP ($ per cap) =+ Trade Bal (% GDP) (Round to the nearest integer as needed.) Compare the intercepts and the slopes for the two least squares equations. Since the 95% confidence interval for the intercept from the original model without country X slope from the original model the intercept from new model, the slopes (b) Explain any differences between and se for the two fits considered in part (a). the intercept from the new model with the country X, the intercepts ▼ significantly different. significantly different. Since the 95% confidence interval for the OA. The value of r² is significantly larger for the new model with country X. This is because country X has the largest response. The value of s, is significantly larger for the new model with country X. This is also because country X has the largest response. OB. The value of r² does not change significantly because country X is fairly close to the least squares regression line. The value of s, is significantly larger for the new model with country X. This is because country X has the largest response. OC. The value of r² is significantly larger for the new model with country X. This is because country X has the largest response. The value of s does not change significantly because the residual for country X is typical. (c) Country X has the second smallest population among the countries. Does this explain the size of the difference between the two equations in part (a)? Explain. O A. No; unless country X has an extreme population compared to the other countries, population size does not explain the difference between the two equations in part (a). OB. Yes; population size is a lurking variable since it affects the GDF trade balance for country X could I due to its siz which is smaller than most of the other countries. OC. No; the regression models do not take the sizes of the countries into account. O D. All of the population data must be provided in order to answer this question. An economic organization tracks summary statistics of various countries. These include GDP (gross domestic product per capita) and trade balances (measured as a percentage of GDP). Exporting countries tend to have large positive trade balances. Importers have negative balances. The data are shown in the accompanying table. Formulate the SRM with GDP as the response and Trade Balance as the explanatory variable. Complete parts (a) through (c) below. Click the icon to view the data table. Find the least squares equation without country X. Complete the equation below. Estimated GDP ($ per cap) =+ Trade Bal (% GDP) (Round to the nearest integer as needed.) Find the least squares equation with country X. Complete the equation below. Estimated GDP ($ per cap) =+ Trade Bal (% GDP) (Round to the nearest integer as needed.) Compare the intercepts and the slopes for the two least squares equations. Since the 95% confidence interval for the intercept from the original model without country X slope from the original model the intercept from new model, the slopes (b) Explain any differences between ² and so for the two fits considered in part (a). OA. The value of r2 is significantly larger for the new model with country X. This is because response. OB. The value of r² does not change significantly because country X is fairly close to the le OC. The value of r² is significantly larger for the new model with country X. This is because (c) Country X has the second smallest population among the countries. Does this explain the O A. No; unless country X has an extreme population compared to the other countries, pop O B. Yes; population size is a lurking variable since it affects the GDP. The trade balance fo OC. No; the regression models do not take the sizes of the countries into account. O D. All of the population data must be provided in order to answer this question. Data Table Trade Balance (% GDP) 6.9 13.1 -3.5 -5.8 9 9.9 7.3 14.2 -0.6 7 15.2 4.6 4.2 -1.3 -4.2 2.2 -4.4 7.2 2.7 -5.6 Print GDP ($ per capita) 48,842 59,555 10,762 33,467 26,563 45,205 38,112 38,278 11,963 46,864 34.739 48,197 14.029 16,881 31,226 17,516 30,606 56,514 45,967 5,946 Done - X k, the intercepts significantly different. Since the 95% confidence interval for the arger for the new model with country X. This is also because country X has the largest the new model with country X. This is because country X has the largest response. e significantly because the residual for country X is typical. s in part (a). other countries.
Expert Answer:
Answer rating: 100% (QA)
Enter data in EXCEL Goto DataData AnalysisRegression Click OK Select GDP per capit... View the full answer

Related Book For 

Operations Management Creating Value Along the Supply Chain
ISBN: 978-1118301173
1st Canadian Edition
Authors: Roberta S. Russell, Bernard W. Taylor, Ignacio Castillo, Navneet Vidyarthi
Posted Date:
Students also viewed these mathematics questions
-
Complete parts a through c below for the continuous data in the accompanying table. Click the icon to view the data table. a) Construct a frequency distribution using the 2" zn rule. Select the...
-
The frequency distribution shown in the accompanying table depicts the property and marine losses incurred by a large oil company over a two-year period. In the insurance business, each loss interval...
-
General Foundry's project crashing data are shown in Table 12.9. Crash this project to 13 weeks using CPM. What are the final times for each activity after crashing? TIME (WEEKS) COST (S) CRASH COST...
-
Run experiments to determine the relative costs of Math.exp() and the methods from EXERCISE 1.3.38 for computing e x : the direct method with nested for loops, the improvement with a single for loop,...
-
For each pair of occupations listed, identify the one for which the kind of car a person drives is more likely to be a good indication of how good she is at her job. a. Elementary school teacher,...
-
Key figures (RMB 000s) for GOME (www.GOME.com.hk), which is the leading chain retailer of consumer electronic products and household appliances in China, follow. Required 1. Use these data and those...
-
Redesign the VOCs adsorber of Example 9.15 for a breakthrough time of \(4.0 \mathrm{~h}\). The pressure drop through the bed [calculated using the Ergun equation (2-95)] should not exceed \(1.0...
-
Accounting for R&D Costs Margaret Avery Company from time to time embarks on a research program when a special project seems to offer possibilities. In 2009 the company expends $325,000 on a research...
-
Consider a market with 4 agents a,...,d and 4 houses 1,...,4. The preference orders of agents over the houses are given by a: 1>2>3>4 b:1>2>3>4 c:1>2>3>4 d:4>3>2>1 How many Pareto efficient...
-
Southeastern Foods has hired you to analyze their distribution-system design. The company has 11 distribution centers, with monthly volumes as listed below. Seven of these sites can support...
-
Which type of financial statement shows how every category of expense is allocated?
-
As a small business owner, briefly describe how you can help your managers understand the importance of organizational behavior? Provide a specific example to help explain your answer
-
To assess your understanding of the readings, you are to respond to the following reflection questions. Part III Levin begins chapter 8 with the following observation: "Our souls and our institutions...
-
At the end of the financial reporting period, Sean realises that a change to the operational budget is required due to an increase in the costs of raw materials and a wage increase that was not...
-
What stage is this building in its financial and physical lifecycle? What risks should investors be aware of during this stage? Hint...look up definition of life cycle before responding. It's helpful...
-
At what minimum speed can a vehicle navigate a curve of radius r = 260 m without slipping if the banking angle is 0 = 14.0 and the static coefficient of friction between the tires and the road is s =...
-
You need to forecast potential risks in planning this "Grad Job Fair" event, which include: 1. Identify a specific technical aspect that may pose a risk. 2. Outline the 3 key milestones (date and...
-
Sheldon and Leonard had a million-dollar idea. In order to make it happen, they have to do special research first. Only Kripke can help them in this matter. But Kripke is known to be the first-class...
-
During registration at Poly every quarter, students in the Faculty of Management must have their courses approved by the departmental adviser. It takes the adviser an average of five minutes...
-
The Cascades Swim Club has 300 shareholders, each holding one share of stock in the club. A share of club stock allows the shareholders family to use the clubs heated outdoor pool during the summer...
-
Exotech Computers manufactures computer components such as chips, circuit boards, motherboards, keyboards, LCD panels, and the like and sells them around the world. It wants to construct a new...
-
Do any problems arise when translating physical assets and economic events into monetary units? Give one or two illustrations to support your answer.
-
Entries for the Warren Clinic 2015 income statement are listed below in alphabetical order. Reorder the data in proper format. Depreciation expense General/administrative expenses Interest expense $...
-
Brandywine Homecare, a not-for-profit business, had revenues of \($12\) million in 2015. Expenses other than depreciation totaled 75 percent of revenues, and depreciation expense was \($1.5\)...

Study smarter with the SolutionInn App