

Question: B F A B D E G H 1 Date HSI 0008.HK 0009.HK IBM T GE RF 2 June 30, 2019 20.00 4.11 0.22 126.30
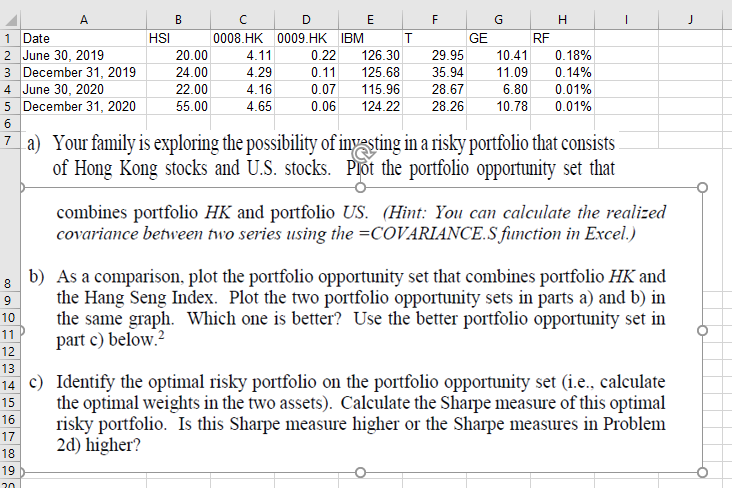
B F A B D E G H 1 Date HSI 0008.HK 0009.HK IBM T GE RF 2 June 30, 2019 20.00 4.11 0.22 126.30 29.95 10.41 0.18% 3 December 31, 2019 24.00 4.29 0.11 125.68 35.94 11.09 0.14% 4 June 30, 2020 22.00 4.16 0.07 115.96 28.67 6.80 0.01% 5 December 31, 2020 55.00 4.65 0.06 124.22 28.26 10.78 0.01% 6 7 a) Your family is exploring the possibility of investing in a risky portfolio that consists of Hong Kong stocks and U.S. stocks. Piot the portfolio opportunity set that combines portfolio HK and portfolio US. (Hint: You can calculate the realized covariance between two series using the =COVARIANCE.S function in Excel.) 8 9 10 11 12 13 b) As a comparison, plot the portfolio opportunity set that combines portfolio HK and the Hang Seng Index. Plot the two portfolio opportunity sets in parts a) and b) in the same graph. Which one is better? Use the better portfolio opportunity set in part c) below.? 15 14 c) Identify the optimal risky portfolio on the portfolio opportunity set (i.e., calculate the optimal weights in the two assets). Calculate the Sharpe measure of this optimal 16 risky portfolio. Is this Sharpe measure higher or the Sharpe measures in Problem 2d) higher? 17 18 19 20 B F A B D E G H 1 Date HSI 0008.HK 0009.HK IBM T GE RF 2 June 30, 2019 20.00 4.11 0.22 126.30 29.95 10.41 0.18% 3 December 31, 2019 24.00 4.29 0.11 125.68 35.94 11.09 0.14% 4 June 30, 2020 22.00 4.16 0.07 115.96 28.67 6.80 0.01% 5 December 31, 2020 55.00 4.65 0.06 124.22 28.26 10.78 0.01% 6 7 a) Your family is exploring the possibility of investing in a risky portfolio that consists of Hong Kong stocks and U.S. stocks. Piot the portfolio opportunity set that combines portfolio HK and portfolio US. (Hint: You can calculate the realized covariance between two series using the =COVARIANCE.S function in Excel.) 8 9 10 11 12 13 b) As a comparison, plot the portfolio opportunity set that combines portfolio HK and the Hang Seng Index. Plot the two portfolio opportunity sets in parts a) and b) in the same graph. Which one is better? Use the better portfolio opportunity set in part c) below.? 15 14 c) Identify the optimal risky portfolio on the portfolio opportunity set (i.e., calculate the optimal weights in the two assets). Calculate the Sharpe measure of this optimal 16 risky portfolio. Is this Sharpe measure higher or the Sharpe measures in Problem 2d) higher? 17 18 19 20
Step by Step Solution
There are 3 Steps involved in it

Get step-by-step solutions from verified subject matter experts