

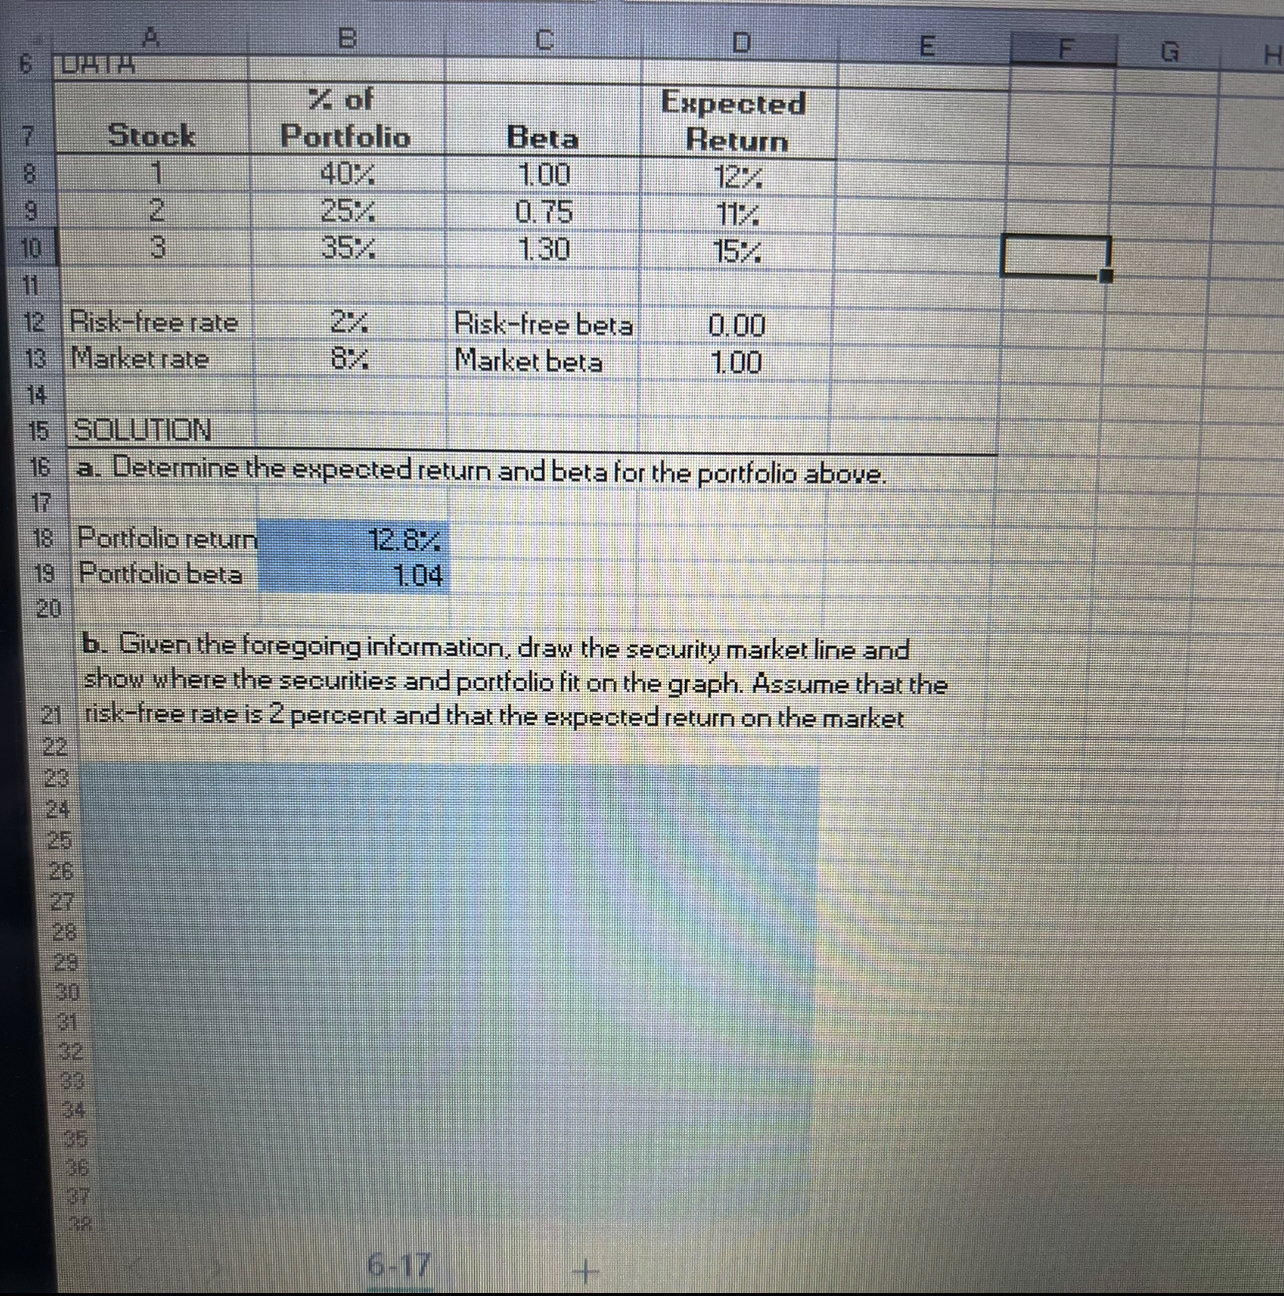
Question: b . Given the foregoing information, draw the security market line and show where the securities and portfolio fit on the graph. Assume that the
b Given the foregoing information, draw the security market line and show where the securities and portfolio fit on the graph. Assume that the riskfree rate is percent and that the expected return on the market
In cells A:D insert a Scatter Chart to show the security market line and the stock from your portiolio.
Inserting a Chart
On the Insert tab, in the Charts group, click the arrow next to Insert Scatter XY or Bubble Chart and choose Scatter Chart.
Selecting Data Series
Then in Select Data Source window, delete any series created automatically.
Add new senes for the security market line using cells D:D for the X values and cells B:B for the Y values. Do not name the series
Add new series for the stock from your portfolio using cell B for the X value and cell B for the Y value. Do not name the series.
Trendline Options
Select any point of the security market line and right click on it Choose Add Trendline. In the Trendline Options window, select Linear with automatic trendine name. Set the forecast forward period at the value of
Edit Chart Elements
Select the point for the stock and right click on it Choose Add Data Labels. Right click on a point again and choose Format Data Labels. In the Label Options window, check the Y Value box.
Add a chart title and choose Above chart option. Replace Chart Titles with Security Market Line. Add axis titles. Replace Axis Title for the horizontal axis with Beta and Axis Title for the vertical axis with Return.
Important note: All calculations must be shown using cell references. Do NOT enter absolute numbers in the cells.In cells A:D insert a Scatter Chart to show the security market line and the stock from your portfolio.
Inserting a Chart
On the Insert tab, in the Charts group, click the arrow next to Insert Scatter X Y or Bubble Chart and choose Scatter Chart.Selecting Data Series
Then in Select Data Source window, delete any series created automatically.
Add new series for the security market line using cells D:D for the X values and cells B:B for the Y values. Do not name the series.
Add new series for the stock from your portfolio using cell B for the X value and cell B for the Y value. Do not name the series.Trendline Options
Select any point of the security market line and right click on it Choose Add Trendline. In the Trendline Options window, select Linear with automatic trendline name. Set the forecast forward period at the value of Edit Chart Elements
Select the point for the stock and right click on it Choose Add Data Labels. Right click on a point again and choose Format Data Labels In the Label Options window, check the Y Value box.
Add a chart title and choose the Above Chart option. Replace Chart Title with Security Market Line. Add axis titles Replace Axis Title for the horizontal axis with Beta and Axis Title for the vertical axis with Return
Step by Step Solution
There are 3 Steps involved in it
1 Expert Approved Answer
Step: 1 Unlock

Question Has Been Solved by an Expert!
Get step-by-step solutions from verified subject matter experts
Step: 2 Unlock
Step: 3 Unlock