

Question: (Security market line) a. Determine the expected return and beta for the portfolio in the popup Window I b. Given the foregoing information, draw the
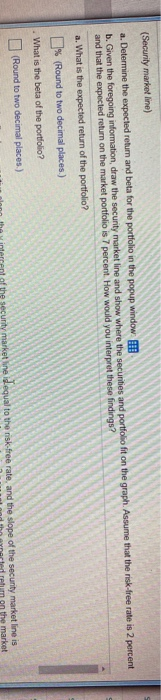
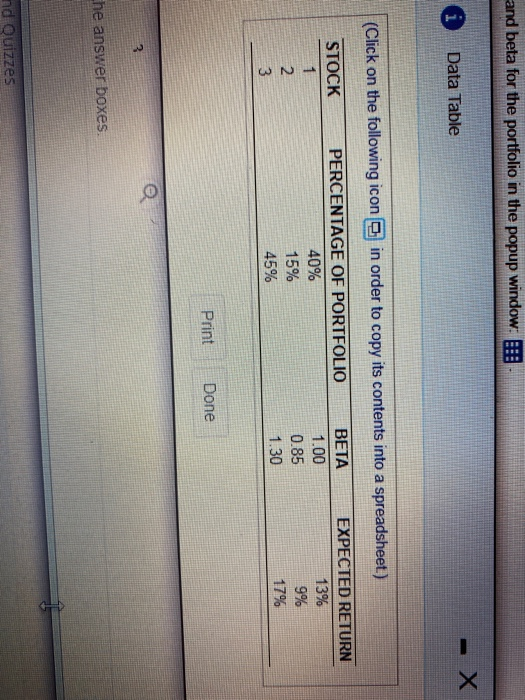
(Security market line) a. Determine the expected return and beta for the portfolio in the popup Window I b. Given the foregoing information, draw the security market line and show where the securities and portfolio fit on the graph. Assume that the risk-free rate is 2 percent and that the expected return on the market portfolio is 7 percent. How would you interpret these findings? a. What is the expected return of the portfolio? % (Round to two decimal places.) What is the beta of the portfolio? (Round to two decimal places.) on the interment of the security market line is equal to the risk.free rate, and the slope of the security market line is lond the norte run on the market and beta for the portfolio in the popup window i Data Table (Click on the following icon in order to copy its contents into a spreadsheet) STOCK EXPECTED RETURN 13% PERCENTAGE OF PORTFOLIO 40% 15% 45% BETA 1.00 0.85 1.30 9% 17% Print Done the answer boxes nd Quizzes
Step by Step Solution
There are 3 Steps involved in it

Get step-by-step solutions from verified subject matter experts